Building Real-Time Data Pipelines for F1 Telemetry
Build sub-150ms F1 telemetry pipelines: ingest with Kafka/MQTT, process with Flink/Kafka Streams, and store time-series data with TimescaleDB or InfluxDB.

F1 telemetry generates over 1.1 million data points per second from 300 sensors per car, amounting to 160 terabytes of data during a race weekend. This data is crucial for making split-second decisions, like optimizing pit stops, managing tire wear, and preventing mechanical failures. Real-time pipelines process this data within 150 milliseconds, enabling teams to gain actionable insights during races. However, challenges like latency, database limitations, and data inconsistencies make managing this data complex.
Key Takeaways:
- Data Ingestion: Tools like Apache Kafka and MQTT handle massive telemetry streams efficiently.
- Real-Time Processing: Frameworks like Kafka Streams and Apache Flink analyze data for insights, such as driver performance and mechanical issues.
- Storage: Time-series databases like TimescaleDB and InfluxDB store telemetry data for immediate and long-term use.
- Scalability: Kubernetes and containerization ensure pipelines can handle data surges during race events.
By combining the right tools, technologies, and strategies, F1 teams transform raw telemetry into real-time insights that can influence race outcomes and ensure car reliability.
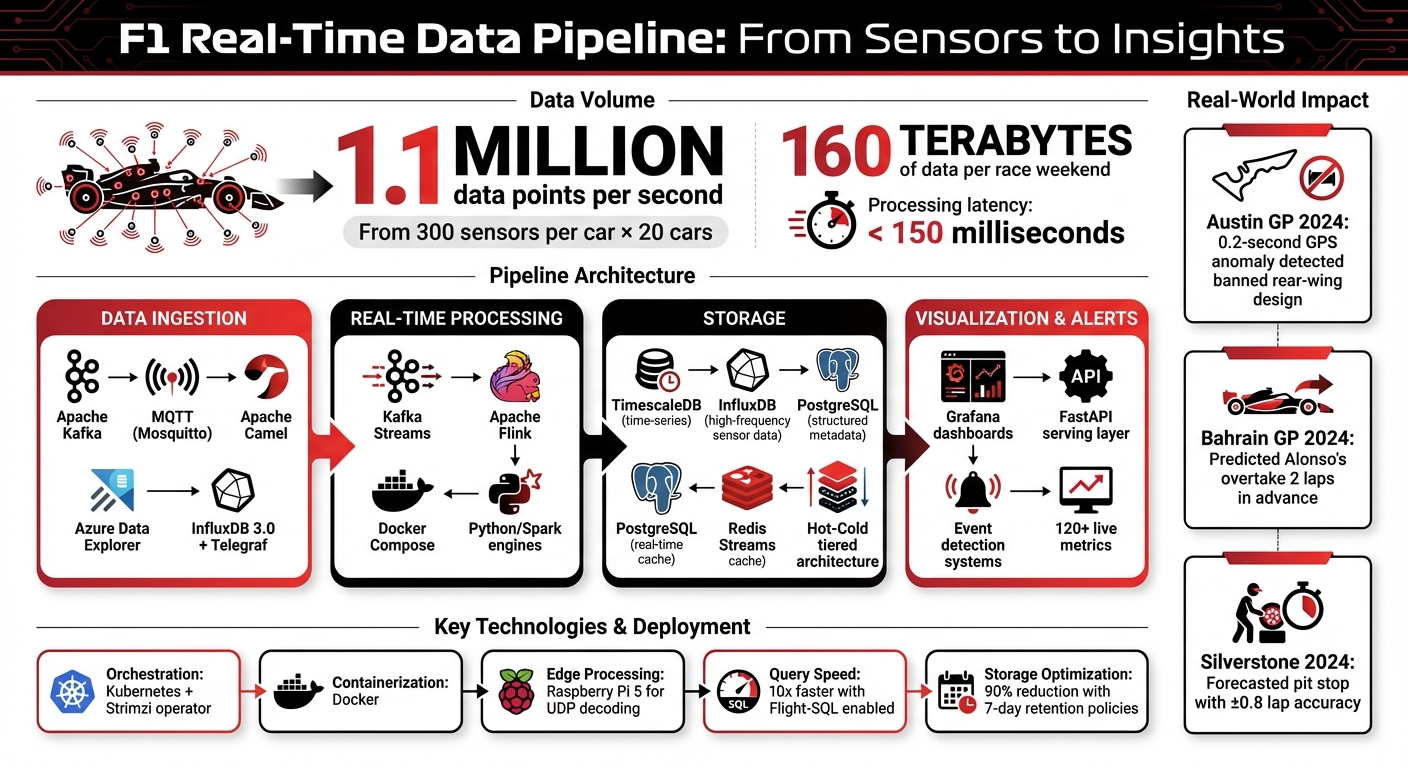
F1 Real-Time Telemetry Data Pipeline Architecture and Statistics
Tools for Data Ingestion and Streaming
Data Ingestion Tools
Picking the right tools for data ingestion is a critical step in building scalable, real-time pipelines for F1 telemetry. One of the most prominent tools for this task is Apache Kafka, which excels at handling large-scale telemetry data. Paolo Patierno, Principal Software Engineer at Red Hat, highlights its capabilities:
"The first step is to ingest the telemetry data into a system that is able to provide low latency, high throughput, and durable storage. The ideal answer is Apache Kafka" - Paolo Patierno, Red Hat
When paired with the Strimzi operator on Kubernetes, Kafka becomes even more powerful. This setup allows Kafka clusters to be cloud-native and highly scalable, managing brokers, topics, and users through Custom Resource Definitions (CRDs).
The ingestion process often begins with Apache Camel, which bridges protocols by taking raw UDP data from cars and routing it into designated Kafka topics. For lighter setups or edge devices, Mosquitto MQTT offers a simpler alternative for basic data ingestion.
For managed solutions, Azure Data Explorer (ADX) provides low-latency ingestion with built-in time-series support. Another strong option is InfluxDB 3.0, which works seamlessly with Telegraf for MQTT data consumption. When Flight-SQL is enabled in InfluxDB 3.0, query speeds for time-series data can increase by up to 10x.
Once the ingestion pipeline is set up, the next step is leveraging real-time streaming frameworks to process this data and extract actionable insights.
Streaming Technologies for Real-Time Processing
After data ingestion, real-time streaming frameworks take over to analyze and transform the data as it flows. Tools like Kafka Streams and Apache Flink are particularly effective for tasks such as aggregating metrics, comparing driver performance, and detecting critical events like G-force spikes or mechanical failures. These frameworks organize telemetry data into specialized topics, including raw decoded packets, aggregated driver stats (e.g., car status, motion, lap data), and race-specific events like speed traps or best laps.
A notable example of real-time processing in action occurred during the October 2024 Austin GP. A student used Kafka and Leaflet.js to analyze live GPS data against the FIA's "driver default" racing line. By identifying a 0.2-second GPS anomaly, the project uncovered a banned flexible rear-wing design, prompting a technical directive. This demonstrates how real-time analysis can directly influence race outcomes by enabling quick, informed decisions.
For containerized environments, Docker Compose simplifies the deployment of stacks involving MQTT brokers, InfluxDB, and Grafana. This approach supports rapid setup and scaling, which is essential during high-demand race weekends when all 20 cars combined can generate around 160 terabytes of data.
Building Real-Time Processing Pipelines
Data Transformation and Aggregation
When raw telemetry data arrives as UDP packets, it needs immediate decoding and standardization to be useful. F1 cars generate a staggering 1.1 million data points per second from around 300 sensors. This creates a constant flow of data that requires quick and efficient handling.
The process begins by decoding these packets into structured formats that include details like driver information, car status, and lap times. However, this raw data is often inconsistent, so standardization is essential for reliable use. This involves tasks like re-aligning time coordinates, explicitly setting data types, and filling in missing values to ensure the data is ready for SQL operations.
A great example of this in action is Atharva Mandavkar's F1 IntelliHub platform, which was showcased in March 2026. Using Python and the FastF1 library, his data_processor.py script standardizes telemetry data and leverages TimescaleDB hypertables to manage millions of rows - covering metrics like speed, throttle, braking, and RPM - with millisecond-level query speeds. By partitioning data using microsecond timestamps, the system avoids the slowdowns that typically plague standard PostgreSQL B-Tree indexes.
One major challenge is dealing with session interruptions, such as red flags. When these occur, the pipeline must detect time gaps and insert "NULL" markers into the data. This step is critical because, without it, visualization tools might incorrectly interpolate data, showing cars "moving" during stoppages when they are actually stationary in the pit lane.
Once the data is cleaned and aggregated, the system is ready to detect and respond to key events seamlessly.
Event Detection and Alerts
The next step is transforming this standardized data into real-time insights and alerts. This involves combining threshold-based rules with contextual understanding to differentiate between critical events and irrelevant noise.
For instance, during the Bahrain GP in 2024, an independent developer created "Clipping-Claw", a tool that used Redis Streams and Grafana annotations to overlay ERS "clipping" flags on live throttle data. By identifying energy-store depletion patterns, the system predicted Fernando Alonso's overtake on Carlos Sainz two laps in advance. Another example is the "Tire-X-Ray" project deployed at Silverstone 2024. Using an MQTT feed and a Python scikit-learn regression model, it monitored inner-tire carcass temperatures in real time. This allowed the system to forecast Max Verstappen's second pit stop with an accuracy of +/- 0.8 laps.
The architecture behind these systems is decoupled for efficiency. Data ingestion is handled via UDP or WebSockets, while a messaging layer like Kafka or SQS ensures smooth communication. A processing engine, such as Python or Spark, works with FIFO queues to maintain ordered, deduplicated events. In 2024, Formula 1 and AWS launched "Track Pulse," a serverless solution that processes 1.1 million telemetry points per second into actionable insights for broadcasts. This system uses Amazon ECS (Fargate) for containerized processing and a Python-based rule engine to detect race stories like "Catch" and "Big Catch" by analyzing gaps between cars.
"In F1, even a tiny bit of data latency can mean losing a position - or winning a championship!" - Nazarenemustoor
To ensure reliable event sequencing, it's crucial to integrate FIA-coded track statuses (like Yellow Flag, VSC, or Red Flag) as primary filters. These statuses provide essential context, preventing false alerts during caution periods and ensuring telemetry anomalies are interpreted correctly.
Storage Solutions for Telemetry Data
Multi-Modal Storage Systems
When dealing with the massive influx of F1 telemetry data, having a robust storage system is just as crucial as the real-time pipelines that process and analyze it. Consider this: 300 sensors on 20 F1 cars generate a staggering 1.1 million data points per second, leading to approximately 160 terabytes of data over a single race weekend. Handling this volume demands a multi-database approach tailored to different types of data.
Time-series databases like InfluxDB and TimescaleDB are designed to handle high-frequency sensor data such as RPM, throttle position, speed, and brake pressure. For instance, in March 2026, Atharva Mandavkar's open-source project, F1 IntelliHub, combined PostgreSQL 14 for structured metadata with TimescaleDB hypertables for telemetry data. By organizing data with microsecond timestamps, the system achieved millisecond-level query responses, even with millions of rows per session. This setup showcases how time-series databases can be fine-tuned for high-performance telemetry storage.
Meanwhile, relational databases are indispensable for structured data like driver profiles, championship standings, and session metadata. On the other hand, processing spatial data - like translating telemetry coordinates (X, Y, Z) into 2D circuit maps for track dominance analysis - requires custom logic. An example of this in action comes from April 2022, when Microsoft engineer Anshul Sharma built a pipeline using Azure Data Explorer (ADX). This system could ingest simulated F1 telemetry at rates ranging from 20,000 to 150,000 data points per second, with ingestion latency under a second. It also integrated with Grafana for real-time visualization, leveraging Kusto Query Language (KQL) for seamless querying.
"Because F1 telemetry tracking generates hundreds of thousands of rows per session... a standard PostgreSQL B-Tree index would degrade quickly. Querying historical throttle applications across 20 drivers over a 70-lap race could take seconds to minutes, starving the API thread pool." - Atharva Mandavkar, Software Engineer
This multi-modal strategy ensures that both live telemetry and long-term analytics are supported effectively, creating a foundation for further optimization.
Balancing Real-Time and Historical Data Needs
To handle both immediate and long-term data requirements, a tiered 'hot–cold' architecture is often employed. Engineers on the pit wall need lightning-fast access to real-time data, typically with latency under 150 milliseconds, while historical data is archived for post-race analysis. This setup often uses tools like Redis Streams or InfluxDB for real-time needs, while storing aggregated data for long-term purposes.
Retention policies play a critical role in managing storage costs. For example, keeping high-resolution raw telemetry data in InfluxDB for just seven days can reduce disk space usage by up to 90% compared to storing raw JSON indefinitely. After this window, only aggregated metrics - like lap averages or sector times - are retained, ensuring that granular data is available when it’s most relevant, such as during race weekends, without overwhelming storage systems.
Smart-Sync mechanisms add another layer of reliability. For example, F1 IntelliHub uses an idempotent loader to track which records have already been stored. This allows seamless recovery from connection drops without duplicating data. To enhance frontend performance, a 'data-version' endpoint is polled every 30 seconds, triggering cache updates only when new data is available.
This tiered approach, combined with intelligent data management practices, ensures that F1 teams can meet the demands of both real-time decision-making and long-term analytical insights without compromising efficiency.
Deploying and Scaling Your Data Pipelines
Containerization and Microservices
Once you've got your storage architecture set up, the next step is deploying your pipeline to meet the intense demands of live F1 races. Tools like Docker for containerization and Kubernetes for orchestration allow you to manage ingestion, processing, storage, and visualization independently and efficiently.
A modular setup is essential here. For example, in March 2026, Atharva Mandavkar's F1 IntelliHub divided its system into four distinct layers: Ingestion, Storage, Serving, and Presentation. The backend was built with FastAPI and Pydantic, while the frontend leveraged Next.js 14 with React Server Components to reduce JavaScript payloads and avoid performance bottlenecks.
Deploying Kafka on Kubernetes becomes easier with the Strimzi operator, which handles brokers declaratively:
"The Strimzi operator will watch the custom resources reflecting changes... taking care of the cluster for you from the installation to the upgrades." - Paolo Patierno, Principal Software Engineer, Red Hat
F1 systems generate data via UDP multicast, which requires a decoding layer in your deployment stack. This can be achieved with a Python or Java library running on lightweight hardware like a Raspberry Pi 5 or within a local Docker container. This decoding step converts raw UDP packets into structured formats like JSON or MQTT topics before sending them to cloud storage.
With the deployment process in place, the focus shifts to scaling your pipeline to handle the high data loads during race events.
Scaling During Race Events
Race weekends are a data tsunami. Consider this: 20 cars, each equipped with around 300 sensors, generate 1.1 million data points every second. Your pipeline must scale dynamically to manage this surge without compromising performance or missing critical telemetry.
Kubernetes-native orchestration is your go-to solution for scaling. By using Strimzi to manage Kafka clusters, you can configure broker settings declaratively to handle spikes during high-demand moments like qualifying sessions or race starts.
Another effective strategy is smart-polling. F1 IntelliHub implemented a lightweight versioning endpoint that pings every 30 seconds to trigger cache updates, reducing unnecessary overhead. For local setups, edge processing plays a crucial role. Running ingestion scripts on a Raspberry Pi 5 or similar device allows you to decode UDP streams locally and send only aggregated data to the cloud. This approach keeps latencies under 150 ms.
Session gaps, such as during red flags or stoppages, require careful handling. Injecting 'NULL' markers during these periods ensures that visualizations don’t misrepresent on-track events. This approach preserves the integrity of your charts and prevents misleading interpolations.
Building a Real-Time F1 Telemetry Dashboard with Pinot and Flink on AWS | Let's Talk About Data
Conclusion: Real-Time Insights in F1
Building a real-time telemetry pipeline isn't just about technology - it's about turning raw data into race-winning decisions. Imagine correlating a driver's feedback about understeer with exact tire wear data in less than 150 milliseconds. That kind of speed empowers engineers to make quick, informed adjustments that can change the course of a race. With each F1 car generating around 1.1 million telemetry data points every second, the ability to process and act on this information is a game-changer.
Recent races have shown how these pipelines can predict performance shifts, refine race strategies, and even prevent mechanical failures. Whether it's timing a pit stop perfectly or enabling a strategic overtaking move, the impact is immediate and measurable.
These systems also act as critical safety nets. By continuously monitoring variables like brake disc temperatures, water pressure, and oil levels, teams can issue real-time instructions to drivers, helping to avoid catastrophic engine failures.
The architecture behind this pipeline - using tools like Kafka for data ingestion, FastAPI for processing, TimescaleDB for storage, and Grafana for visualization - delivers over 120 live metrics with sub-150 ms latency. This matches the speed of professional pit wall systems, transforming 160 TB of data collected over a race weekend into actionable insights. It’s a modular and scalable design built to handle the staggering speeds and volumes required in modern F1 racing, where every millisecond counts.
FAQs
How do you maintain end-to-end latency under 150 ms?
To maintain latency under 150 ms in F1 telemetry pipelines, teams rely on high-speed wireless links with latencies as low as 10–15 ms. They also use advanced tools like Kafka for data streaming, Grafana for visualization, and Kubernetes for managing workloads efficiently. Custom dashboards, designed with refresh rates below 200 ms, play a crucial role in supporting real-time data monitoring. Together, these strategies ensure fast data transmission and quick decision-making during races.
What’s the best way to handle red-flag data gaps?
Addressing data gaps in F1 telemetry requires a combination of advanced tools and proactive strategies. Real-time monitoring tools like Apache Kafka play a crucial role by keeping an eye on data streams and identifying gaps as they happen. This allows teams to act immediately, minimizing potential disruptions.
To handle missing data points, predictive analytics and machine learning come into play. These technologies can estimate and fill in gaps, as well as foresee potential issues before they escalate. On top of that, redundant sensors and low-latency telemetry systems add a layer of reliability. These measures help ensure continuous data flow, maintain accuracy, and enable teams to make fast, informed decisions during high-pressure race scenarios.
How should telemetry storage be split between hot and cold tiers?
Telemetry storage works best when divided into hot and cold tiers, each serving a specific purpose. The hot tier is designed for real-time data, offering low latency (10-15 milliseconds) to support live monitoring, immediate strategy adjustments, and timely driver feedback. On the other hand, the cold tier is used for storing archived data - like the massive 4 terabytes generated during a race weekend. This tier is ideal for long-term analysis, identifying trends, and powering machine learning models, combining cost-efficient storage with quick access to essential historical data.