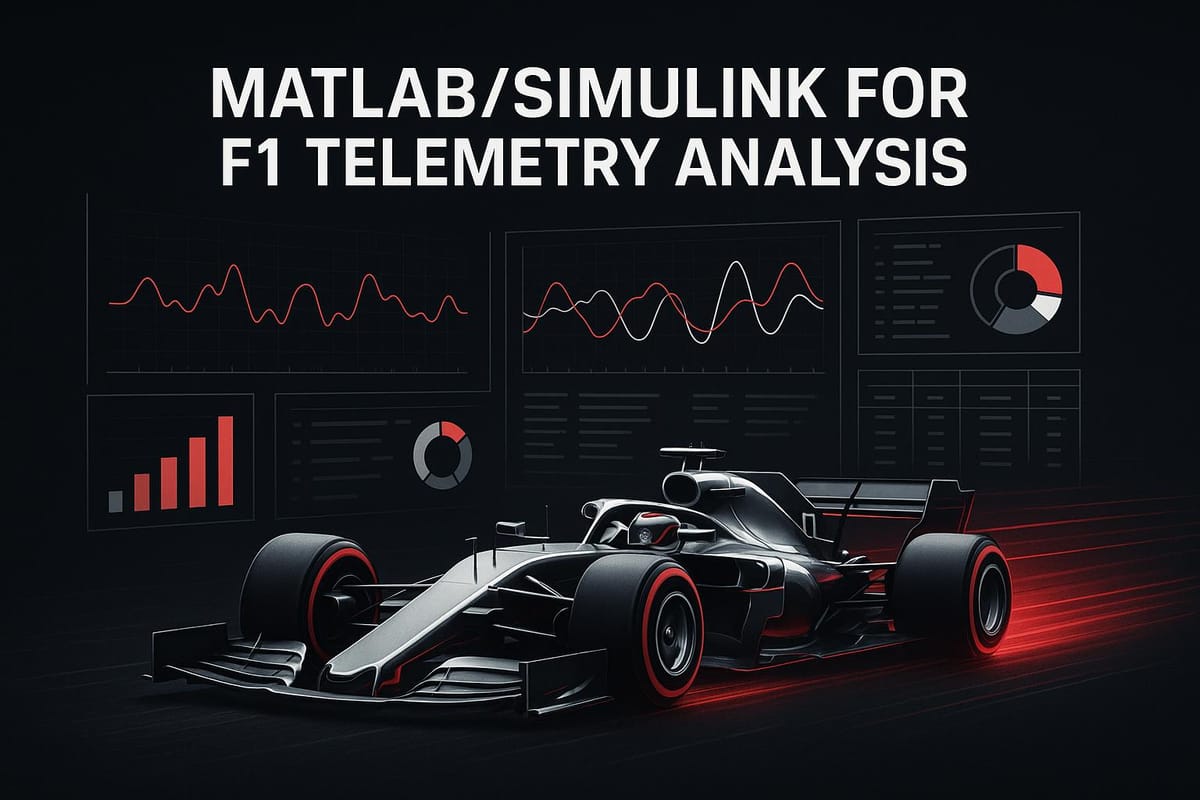
MATLAB/Simulink for F1 Telemetry Analysis
Explore how advanced data analysis and simulation tools transform telemetry data into strategic advantages for Formula 1 teams.

Formula 1 teams rely on MATLAB and Simulink to process and analyze massive telemetry data streams generated by their cars. These tools convert sensor data into actionable insights for optimizing race performance, vehicle setups, and strategy decisions. Here's how they play a key role:
- Data Handling: MATLAB processes real-time telemetry, integrating data from hundreds of sensors like tire temperatures, suspension travel, and aerodynamic pressures.
- Simulation: Simulink models vehicle dynamics, helping teams predict performance, test setups, and refine control systems.
- Real-Time Analysis: Teams use telemetry data during races to make decisions on tire management, fuel consumption, and pit stops.
- Integration: MATLAB and Simulink connect seamlessly with hardware like CAN bus systems, wind tunnels, and simulators, creating a unified workflow.
These tools help teams analyze millions of data points quickly, simulate scenarios, and make informed decisions both on and off the track - giving them a competitive edge in the fast-paced world of Formula 1.
Telemetry Data Collection and Integration
F1 Telemetry Systems Overview
Modern Formula 1 cars are equipped with hundreds of sensors that measure everything from engine RPM and temperatures to suspension travel and aerodynamic pressures. The sheer amount of data generated during a race weekend is staggering.
These telemetry systems rely on a CAN (Controller Area Network) bus architecture, which allows multiple electronic control units (ECUs) to communicate seamlessly without needing a central host computer. Teams use advanced data acquisition systems that sample key parameters - like wheel speed and engine RPM - at incredibly high rates to ensure no critical detail is missed.
Real-time data transmission happens over encrypted radio signals, sending vital information back to the pit wall and even to team headquarters. However, the FIA imposes strict limits on live data transmission during sessions, so teams must carefully decide which parameters to monitor in real time and which to analyze post-session.
Temperature sensors, such as thermocouples, are essential for monitoring the extreme conditions F1 cars endure. These sensors measure everything from ambient temperatures to the intense heat generated by brake discs, tire surfaces, and engine components under heavy loads.
Connecting Telemetry with MATLAB/Simulink

MATLAB and Simulink play a key role in integrating telemetry data with modern engineering workflows. The Vehicle Network Toolbox enables direct connections to CAN bus systems, allowing teams to import both real-time and logged telemetry data. It supports various CAN database formats, like DBC files, which define message structures and signal scaling factors critical for F1 teams.
The process starts with MATLAB's canChannel function, which establishes communication with CAN hardware. Engineers can then capture live data streams using functions like receive or analyze historical data with precise timestamps using tools such as canMessageTimetable.
Simulink takes this a step further with its CAN Pack and CAN Unpack blocks, which allow telemetry data to feed directly into vehicle models during simulations. This is especially useful for hardware-in-the-loop (HIL) testing, where real ECUs interact with Simulink models running on real-time systems.
Synchronizing data from different systems, each with its own sampling rate, is critical. MATLAB's synchronize function aligns timestamps across multiple streams, often using GPS timestamps as a master reference. The MATLAB Data Acquisition Toolbox also connects directly to industry-standard hardware, enabling seamless analysis of diverse data sources.
This streamlined integration makes it easier to combine various data streams into a unified framework for deeper analysis.
Combining Multiple Data Streams
Once telemetry data is captured, the challenge lies in merging it with data from other sources. F1 teams deal with inputs from the car's ECU, additional loggers, GPS/IMU sensors, cameras, and even weather monitoring devices. Each system operates on its own time base and sampling frequency, creating a complex puzzle that MATLAB helps solve.
To align these disparate data streams, engineers use MATLAB's interp1 function for resampling. High-frequency data can be downsampled, while lower-frequency data is interpolated to fill gaps, ensuring consistency across all sources.
MATLAB's timetable objects provide a powerful framework for managing multi-stream data. Engineers create separate timetables for each source and merge them using the synchronize function. Depending on the data type, methods like "linear", "previous", or "next" ensure smooth integration.
Validating data is a critical step when combining streams. Functions like isoutlier - using methods such as "median" or "quartiles" - help identify anomalies, like a sudden spike in tire temperature without corresponding braking activity, which could indicate a sensor issue.
Cross-correlation analysis is another tool engineers use to uncover relationships between parameters. For instance, MATLAB's xcorr function can reveal how aerodynamic changes might affect tire performance over time or how throttle adjustments influence fuel consumption on specific track sections.
To preserve data integrity, engineers use table joins to combine related measurements while enforcing physical constraints. MATLAB's table join operations, combined with custom validation scripts, ensure that impossible scenarios - like negative fuel levels - are flagged and corrected. These unified datasets lead to more accurate simulations in MATLAB and Simulink models, giving teams a clearer picture of their car's performance.
From Telemetry Data to Suspension Modeling
Analyzing and Displaying Telemetry Data
When it comes to Formula 1, telemetry data is the backbone of performance analysis. Extracting insights from millions of data points is no small feat, but MATLAB and Simulink make it manageable. These tools help engineers turn raw sensor data into actionable insights, guiding decisions both on and off the track.
Key MATLAB Functions for Data Analysis
MATLAB's Signal Processing Toolbox is a go-to resource for cleaning and analyzing sensor data. For example, the filtfilt function removes noise without causing phase delays, which is critical when studying high-frequency vibrations in components like suspension systems or engine mounts. Engineers often pair butter and filtfilt to apply Butterworth filters, ensuring accelerometer data remains clean while preserving timing accuracy.
Statistical analysis tools in MATLAB also play a major role. The movmean function helps engineers calculate rolling averages, such as tracking tire temperature changes over time. This reveals thermal buildup trends that aren't obvious from raw data. Similarly, the corrcoef function identifies correlations between variables - like how brake balance adjustments might affect tire wear in specific track sections.
Frequency domain analysis is another essential technique. Using fft to uncover hidden patterns and pwelch to estimate power spectral density, teams can identify critical resonant frequencies in components like aerodynamic parts, which may impact handling.
MATLAB's optimization functions are indispensable for fine-tuning car setups. For instance, the fmincon function helps engineers find the best suspension settings by minimizing predicted lap times. These optimizations balance competing factors such as mechanical grip and aerodynamic efficiency.
Custom algorithms built with MATLAB's matrix operations take analysis a step further. Using pdist2, engineers can compare racing lines by analyzing multidimensional data like speed, throttle position, and steering angles. This helps uncover subtle differences in driving styles that traditional analysis might overlook.
Once the data is analyzed, Simulink takes over for visualization and modeling, turning insights into actionable strategies.
Creating Visual Reports from Telemetry Data
Visualizing telemetry data makes it easier for engineers, strategists, and drivers to understand complex information. MATLAB's plotting tools enable the creation of detailed, insightful visualizations that go beyond basic graphs.
Multi-parameter plots are a great example. By using subplot and yyaxis, teams can overlay different metrics - such as throttle position, engine RPM, and fuel flow - on a single timeline, even if they have varying scales. The stackedplot function is particularly useful for showing multiple parameters with shared time axes, making it simple to identify correlations across systems.
Heat maps provide a clear way to analyze tire temperature distribution across different track sections. With functions like heatmap and imagesc, engineers can quickly spot problem areas where temperatures exceed optimal ranges by visualizing data in color-coded matrices.
For more complex relationships, 3D surface plots created with surf and mesh functions are invaluable. Teams often use these to visualize how lap times vary with changes in front and rear wing angles. Adding contour plots to these surfaces highlights the most effective configurations.
Geographic visualization brings telemetry data to life by mapping performance metrics onto track layouts. MATLAB's mapping tools allow engineers to overlay speed, braking, and acceleration data onto the circuit, using scatter plots with color-coded markers to show where drivers gain or lose time.
Real-time analysis is also critical. Dashboards built with MATLAB's App Designer allow live monitoring during practice sessions. These dashboards use components like uitable and uigauge to display key metrics, with automatic alerts for out-of-range values. Custom callback functions ensure the data updates seamlessly as new telemetry packets arrive.
For comparing setups, comparative analysis plots are highly effective. By using the plot function with different line styles and colors, teams can visualize how changes impact performance. The tiledlayout function makes it easy to present clear before-and-after comparisons.
These visualizations not only help teams interpret data but also set the stage for Simulink's real-time modeling capabilities.
Using Simulink for Modeling and Simulation
Simulink provides a block-based modeling environment that allows F1 teams to create detailed vehicle simulations. These models incorporate real telemetry data, serving as virtual test beds for evaluating setup changes and predicting performance under different scenarios.
Vehicle dynamics models in Simulink capture the complex interplay between the chassis, suspension, tires, and aerodynamics. The Powertrain Blockset includes pre-built components for engine modeling, while custom blocks handle F1-specific systems like energy recovery units (ERS). Engineers use Integrator blocks for vehicle motion and Gain blocks to represent physical constants and setup parameters.
Tire models are particularly advanced, factoring in temperature-dependent grip and wear patterns observed in telemetry data. Lookup Table blocks store grip curves based on real tire performance data, while Thermal Mass blocks simulate temperature dynamics. These models help predict how tires will behave during long stints.
Aerodynamic modeling uses 3D Lookup Table blocks to simulate downforce and drag as functions of ride height, wing angles, and speed. Data from wind tunnel tests and track sessions feed these models, ensuring accurate predictions of aerodynamic behavior.
Simulink also excels at control system modeling, simulating driver inputs and electronic systems. The PID Controller block models systems like traction control, while custom MATLAB Function blocks implement advanced control algorithms. This allows teams to test new strategies in a virtual environment before deploying them on the car.
Hardware-in-the-loop (HIL) testing connects Simulink models with real-world ECUs and control systems. Using the Real-Time Workshop, engineers can generate code that runs on dedicated hardware, integrating simulated dynamics with actual car components. This ensures control algorithms are validated before track testing.
Simulink also supports Monte Carlo simulations, which model uncertainties like track conditions and tire performance. By running thousands of iterations, engineers can identify setup configurations that consistently perform well under varying conditions.
Finally, the Simulink Real-Time environment ensures models run with precise timing, which is critical for HIL applications. This capability enables teams to test race strategies and driver aids in a controlled setting, refining them before race day.
Combining Telemetry with Simulation for Performance Analysis
Using telemetry data directly within simulation models creates a powerful feedback loop. Real-world performance data validates virtual predictions, helping teams fine-tune setups and explore scenarios more efficiently. This approach minimizes the need for exhaustive on-track testing, saving both time and resources.
Creating Vehicle Models in Simulink
With a unified data framework in place, Simulink enables precise replication of vehicle dynamics through simulation models. The process begins by breaking the car down into essential subsystems:
- Engine Models: Simulate torque curves and fuel consumption, while custom blocks handle energy recovery and deployment via the MGU-K.
- Suspension Systems: Spring-damper blocks model each corner of the car, with parameters derived from telemetry. Anti-roll effects are captured using torsional spring blocks.
- Tire Dynamics: Lookup table blocks, populated with sensor data, account for temperature-dependent grip. Integrator blocks track wear over time, reflecting real-world degradation patterns.
- Aerodynamics: Wind tunnel and CFD data populate lookup table blocks to model downforce and drag. These models account for variables like ride height, wing angles, and ground effect losses.
- Chassis Behavior: A six-degrees-of-freedom block calculates overall vehicle motion, incorporating mass properties and center of gravity positions aligned with technical regulations.
Each subsystem integrates seamlessly to create a comprehensive virtual representation of the car.
Real-Time Simulation with Live Telemetry Data
Live telemetry data transforms static models into dynamic tools for prediction and analysis. High-frequency data streams feed directly into Simulink models via specialized acquisition blocks, enabling real-time insights:
- Lap Time Prediction: By comparing live inputs like throttle and brake pressure against optimal profiles, models forecast sector times and overall lap performance.
- Tire Degradation: Real-time tracking of temperature and load cycles helps predict when tire performance will drop, guiding pit stop strategies.
- Fuel Management: Engine telemetry informs models that estimate fuel levels and consumption rates, ensuring compliance with regulations while optimizing usage.
- Setup Optimization: Tire temperature data predicts how aerodynamic adjustments - such as changes to wing angles - will impact performance before physical modifications are made.
- Weather Adaptation: Meteorological data is integrated to model how shifting conditions affect tire grip and pressures, allowing teams to adapt race strategies proactively.
Driver-in-the-Loop Simulators and 3D Tools
Refined models also enable immersive driver-in-the-loop simulations, where drivers interact directly with MATLAB/Simulink models. These simulators provide feedback that mathematical models alone cannot capture.
- Motion Platforms: Actuator blocks replicate vehicle dynamics, translating them into physical movements that mimic real-world behavior.
- 3D Environments: Simulink 3D Animation generates realistic track visuals and cockpit views, accurately representing car geometry and track details.
- Force Feedback and Biometrics: Systems replicate cockpit responses, while sensors like heart rate and eye tracking provide insights into driver workload and ergonomics.
Additionally, comparing multiple drivers within the same simulation environment offers valuable insights. Overlaying driving styles reveals how different techniques impact lap times and tire wear, reinforcing the telemetry-driven decision-making process that gives teams a competitive edge.
Using Telemetry Analysis for Race Strategy and Setup
MATLAB and Simulink play a crucial role in transforming raw telemetry data into actionable insights, helping teams craft smarter race strategies and fine-tune car setups. By combining simulation tools with data analysis, engineers gain a deeper understanding of performance details, enabling precise adjustments during race weekends.
Making Setup Changes Based on Telemetry Data
With MATLAB and Simulink, engineers can dive into sensor data from key systems like aerodynamics, suspension, engine performance, and thermal management. This analysis directly informs setup changes, bridging the gap between simulation models and real-world adjustments. For example, telemetry from aerodynamics and suspension systems helps fine-tune wing angles, ride height, and damper settings. Meanwhile, MATLAB’s thermal modeling capabilities allow teams to predict how components will behave under various conditions, leading to smarter cooling solutions.
Real-Time Decision Making During Races
Live telemetry takes race-day strategy to the next level. By processing data in real time, teams can make immediate decisions that impact race outcomes. For instance, tire performance and fuel consumption patterns guide pit stop timing, while inputs from weather sensors and track condition monitors help refine energy management and pit strategies on the fly. This dynamic approach ensures teams stay responsive to changing race conditions.
Benefits and Drawbacks of MATLAB/Simulink
While MATLAB and Simulink offer significant advantages for telemetry analysis in Formula 1, they also come with a few challenges that teams must navigate.
Advantages of MATLAB/Simulink:
- Data Handling: Efficiently processes large datasets with advanced analytical tools.
- Modeling and Simulation: Offers extensive toolboxes for complex calculations and scenario testing.
- System Integration: Easily connects with existing telemetry systems and third-party tools.
- Visualization: Provides clear plotting and 3D visualization for better data interpretation.
- Collaboration: A unified platform promotes knowledge sharing across team departments.
Challenges to Consider:
- Real-time data processing may require powerful hardware and significant computational resources.
- The platform has a steep learning curve, demanding skilled engineers to maximize its potential.
- Licensing fees for the full suite of toolboxes can be expensive.
- Ensuring simulation models accurately mirror real-world conditions requires rigorous validation and careful management.
Conclusion
MATLAB and Simulink have become indispensable in Formula 1, transforming how teams analyze telemetry and simulate vehicle performance. These tools handle enormous amounts of real-time data, model complex vehicle dynamics, and optimize control systems - all of which directly influence race outcomes. Whether it's evaluating tire temperatures, monitoring engine efficiency, or fine-tuning suspension and aerodynamics, they provide the computational muscle teams need to stay ahead.
Beyond data analysis, their seamless integration capabilities set them apart in motorsport. Teams use these tools to link telemetry with CAD systems and employ Simulink's Hardware-in-the-Loop testing to validate control systems before hitting the track. This end-to-end approach to simulation and analysis has revolutionized decision-making during races.
With computing power advancing and software becoming even more sophisticated, Formula 1 teams are poised to achieve tighter integration between telemetry and simulation. This will refine engineering workflows and further enhance performance on race day.
The rise of MATLAB and Simulink in Formula 1 showcases the sport's constant drive for perfection. Teams that excel in utilizing these tools can transform raw data into game-changing insights, often tipping the scales between winning and losing. As technology progresses, telemetry and simulation will remain pivotal in crafting championship-winning strategies.
FAQs
How do Formula 1 teams use MATLAB and Simulink to analyze telemetry data and improve vehicle simulations?
MATLAB and Simulink in Formula 1: Real-Time Data Analysis
Formula 1 teams rely on MATLAB and Simulink to process and analyze the enormous streams of telemetry data gathered during races and testing. This data includes critical metrics like G-forces, tire pressures, and engine temperatures - all captured in real time. With the ability to handle millions of data points per second, these tools provide teams with highly detailed insights into how their cars are performing on the track.
By combining telemetry data with advanced vehicle models, teams can simulate race conditions, forecast performance, and fine-tune setups to achieve peak results. This integration of real-time data and simulation allows teams to make smarter decisions, adjust strategies effectively, and maintain a competitive edge during race day.
What are the key challenges and advantages of using MATLAB/Simulink for real-time telemetry analysis in Formula 1?
Using MATLAB/Simulink for real-time telemetry analysis in Formula 1 presents both hurdles and benefits. One of the biggest challenges is handling the massive amounts of data produced during a race while keeping latency to an absolute minimum. This demands the use of highly efficient algorithms and top-tier computational power. On top of that, ensuring the system remains reliable in the intense and unpredictable conditions of a race adds another layer of complexity.
That said, the advantages of MATLAB/Simulink are hard to ignore. These tools allow for quicker simulations, which can save both time and money - key factors when testing and fine-tuning strategies. They also shine in data visualization and pattern recognition, making it easier for teams to interpret telemetry data. This capability empowers engineers to make sharp, data-backed decisions that boost vehicle performance and refine race strategies, giving teams a crucial competitive advantage.
How do Formula 1 teams use MATLAB and Simulink to ensure their simulation models are accurate?
Formula 1 teams turn to MATLAB and Simulink to ensure their simulation models align closely with real-world performance. By comparing simulation results with actual sensor data from the cars, engineers can verify that these models accurately mirror vehicle behavior. This process is crucial for making informed decisions during races.
Teams also use driver-in-the-loop simulators, which replicate real driving scenarios in a controlled setting. These simulators allow engineers to test and refine their models, bridging the gap between virtual simulations and on-track performance.
To push accuracy even further, teams analyze simulation outputs against real-world data, conduct both open- and closed-loop testing, and adjust system parameters as needed. Together, these methods help fine-tune telemetry data and vehicle dynamics models - essential tools for achieving peak performance on race day.


