Ground Effect in F1: Simulation Tools Explained
Virtual CFD and wind-tunnel tools drive F1 ground-effect design, but they can't fully predict on-track dynamics like porpoising and ride‑height sensitivity.
Ground effect in Formula 1 is all about using the car's underbody to generate downforce, pulling the car closer to the track for better speed and stability. Modern F1 cars get 60–65% of their downforce from the floor and diffuser, making it a game-changer compared to older designs that relied heavily on wings. However, this aerodynamic principle is highly sensitive to ride height and positioning, requiring precise engineering.
To design and optimize these systems, teams rely heavily on simulation tools due to strict limits on physical testing. CFD (Computational Fluid Dynamics) and wind tunnel testing are the primary methods used:
- CFD: Virtual simulations that model airflow, helping engineers refine designs cost-effectively. It’s especially useful for studying underbody airflow and phenomena like "tire squirt" and diffuser stability.
- Wind Tunnels: Physical testing with scale models to validate CFD results. Rolling roads simulate ground conditions, but there are limits to accuracy due to FIA regulations.
- Combination: Teams integrate CFD and wind tunnel data for better predictions, though real-world performance often reveals gaps.
Despite their importance, these tools have limitations. Neither CFD nor wind tunnels can perfectly replicate track conditions, which is why on-track testing remains crucial for fine-tuning. The upcoming 2026 regulations will push simulation tools further, with active aerodynamics and wake control adding new challenges.
This article dives into how these tools work, their strengths and weaknesses, and the software powering F1's ground effect era.
Main Simulation Tools for F1 Ground Effect Analysis
CFD in F1
Computational Fluid Dynamics (CFD) functions as a virtual wind tunnel, enabling engineers to simulate how air flows around every surface of an F1 car - especially underneath, where the Venturi effect generates critical downforce. By using advanced software, teams can pinpoint which underbody areas contribute the most to downforce. For instance, CFD can analyze "tyre squirt", a jet of air squeezed out from the tire contact patch that may disrupt diffuser performance. Engineers also use CFD to study how stable the ground effect remains when the car’s yaw, roll, or ride height changes. Even slight variations can cause the diffuser to stall, leading to a sudden loss of downforce.
Rosario Giuliana highlights the importance of CFD in F1:
CFD is arguably the most important tool in the aerodynamic development of an F1 car today.
Teams rely on incredibly detailed simulations, often using meshes with over 32 million cells to capture the complex airflow beneath the car. However, the FIA regulates CFD usage by limiting CPU core hours, ensuring teams operate on an even playing field. After virtual testing with CFD, wind tunnel experiments provide the physical validation needed for aerodynamic insights.
Wind Tunnel Testing for Ground Effect
Wind tunnel testing serves as the next step, where teams physically validate designs initially developed through CFD. Using 60%-scale models, teams test in specialized tunnels designed to simulate ground effect conditions. A key feature of these facilities is the rolling road (a moving treadmill beneath the model) that replicates the turbulence created by the ground plane and rotating tires - essential for accurate ground effect analysis.
The scale models are mounted on pylons that allow movement across multiple axes, simulating yaw, roll, and pitch. This setup is critical for assessing how stable the Venturi tunnels remain under different conditions. Models are equipped with sensors to gather real-time pressure data at crucial surface points. To maintain fairness, F1 regulations limit wind tunnel usage based on championship standings. For example, top teams are restricted to 70% of the baseline allocation (roughly 80 hours of "wind on" time annually), while teams lower in the rankings may receive up to 115%. Additionally, the maximum allowed air speed in these tests is capped at 112 mph (180 km/h). Once wind tunnel validation is complete, teams proceed with component production.
However, wind tunnels are not without their flaws. For example, they failed to predict the "porpoising" issue that emerged during the 2022 ground-effect era. This phenomenon only became evident during actual on-track testing.
Combining CFD and Wind Tunnel Data
To ensure aerodynamic performance translates effectively to the track, teams integrate data from both CFD and wind tunnel testing. Some phenomena, such as tyre squirt or porpoising, are challenging to replicate in isolation, so combining these tools helps engineers build a comprehensive understanding of aerodynamic behavior. By placing surface pressure sensors on wind tunnel models in the same locations as virtual probes in CFD, teams can directly compare data from both methods. Aero performance engineers focus on aligning these results with real-world track conditions, a process known as "correlation engineering".
This combined data is used to create an aerodynamic map, which shows how a car’s ground effect performance changes with speed, ride height, and attitude. These maps are essential for predicting whether a new floor design will maintain stable downforce through high-speed corners or risk stalling when the car pitches forward under braking. Despite these advanced tools, Rosario Giuliana points out their limitations:
While CFD and windtunnels are very useful tools, neither of them can fully replicate what happens on track - and that's why on-track running remains the most important tool teams have.
When simulation results fail to match on-track performance, teams revisit their simulation methods and refine their development process. This constant cycle of virtual, physical, and real-world testing is at the heart of modern F1 aerodynamic development.
F1 car porpoising: CFD or tunnels? By Peter Windsor
CFD Software for Ground Effect Simulation
Specialized CFD tools play a key role in refining underbody aerodynamics, an essential step that builds on earlier wind tunnel tests - both virtual and physical.
CONVERGE CFD for Airflow Prediction
CONVERGE CFD is designed to predict airflow structures critical to ground effect performance. It excels in capturing key phenomena like the Y250 vortex, a flow structure that channels air toward the underbody, and managing tire squirt effects. These effects, if not handled properly, can disrupt diffuser efficiency, making precise predictions essential for optimizing downforce.
The software also helps engineers address diffuser stall, a sudden loss of downforce that occurs when the ride height decreases at high speeds. By analyzing airflow changes during braking and cornering, CONVERGE enables teams to maintain stable downforce under varying track conditions. This is critical, as the underbody contributes about 61% of an F1 car's total downforce.
Next, let’s look at an open-source alternative that shines in complex meshing: OpenFOAM with SnappyHexMesh.
OpenFOAM with SnappyHexMesh for Car Meshing
OpenFOAM provides a cost-effective, open-source solution for simulating F1 aerodynamics. It solves the unsteady, incompressible Navier–Stokes equations that dictate airflow around the car. Using SnappyHexMesh, the tool generates detailed 3D hexahedral meshes that capture critical areas like wake regions and high-downforce zones, including the floor and wings. This allows teams to allocate computational resources to the most important aerodynamic surfaces.
A compelling example of OpenFOAM's capabilities comes from Neural Concept, which trained an AI model using a dataset of 1,644 F1-style geometries simulated at 155 mph (250 km/h). The model achieved an R² pressure prediction score of 0.916 on the car surface and 0.967 in the wake plane behind the tires. Even more impressively, it reduced simulation times from hours to just 0.1 seconds. High-fidelity F1 simulations often rely on meshes with 19.2 to 40 million cells, with first-cell heights as small as 0.01 mm to capture boundary layer effects accurately.
For tackling dynamic challenges like porpoising, HELYX offers a specialized approach.
HELYX for Porpoising and Underfloor Dynamics
HELYX, developed by ENGYS, addresses the complex issue of porpoising - a violent bouncing phenomenon in modern ground effect cars. In September 2022, CFD Engineer Apostolos Krassas and his team used HELYX's Generalized Internal Boundary (GIB) technology to simulate this behavior. With a 25-million-cell mesh and kw-SST turbulence, they modeled how diffuser airflow is disrupted when the car contacts the ground and demonstrated the hysteresis in downforce recovery as the car lifts off the track.
The GIB technology eliminates the need for constant re-meshing by snapping the computational grid's internal faces to the car's surface as it moves. This is crucial, as simulating just 0.5 seconds of porpoising requires roughly 7.5 hours on a 128-core computer. HELYX also uses the Realizable k-epsilon turbulence model to calculate aerodynamic coefficients, making it a comprehensive tool for optimizing underfloor dynamics.
Visualization and Analysis Software
When CFD simulations churn out millions of data points, engineers rely on specialized software to make sense of the results. After completing detailed CFD and wind tunnel tests, advanced visualization tools step in to translate massive datasets into meaningful aerodynamic insights. Tools like ParaView, Tecplot, and Ensight transform raw simulation data into visual formats that highlight where downforce is gained or lost.
ParaView for CFD Post-Processing

ParaView is a go-to tool for converting complex simulation outputs into flow maps, pressure contours, and 3D visualizations. These visual aids help engineers pinpoint areas of flow separation and drag. With F1 simulations often involving up to 75 million cells, ParaView’s robust capabilities are critical for breaking down this data. It enables engineers to focus on specific components, analyzing how each contributes to drag and lift with remarkable precision.
One of ParaView’s strengths lies in its ability to uncover details like small-scale vortices, which play a key role in optimizing underfloor performance and ground effect efficiency. Engineers commonly use vertical slices to examine flow phenomena, such as tire-induced vortices, which must be managed to enhance downforce. While traditional simulations can take hours, advancements in AI have slashed this time dramatically, with some tools now predicting flow fields in just 0.1 seconds.
While ParaView shines in detailed post-processing, Tecplot and Ensight offer additional features for interpreting broader aerodynamic patterns.
Tecplot and Ensight for Data Interpretation
Tecplot and Ensight complement ParaView by presenting CFD results through 3D plots and visualizations, making aerodynamic performance easier to interpret. These tools use non-dimensional coefficients (Cp) and color-coded pressure contours to illustrate forces at play - blue hues represent suction or pulling forces, while red hues indicate pushing forces. This color-coding simplifies comparisons across different simulation cases.
A key feature of these tools is the use of total pressure (Cpo) slices, which help visualize wake structures and track vortex behavior, crucial for maximizing ground effect efficiency. For example, during the November 2017 Abu Dhabi Grand Prix, McLaren engineers used surface pressure visualization to diagnose an issue with Stoffel Vandoorne’s diffuser. The analysis pinpointed a malfunction caused by a strip of tape wrapped around a diffuser strake, demonstrating how these tools bridge the gap between simulation data and real-world troubleshooting.
Together, these visualization tools close the loop on CFD analysis, allowing teams to fine-tune aerodynamic designs with extraordinary accuracy.
Challenges and Limitations of Simulation Tools
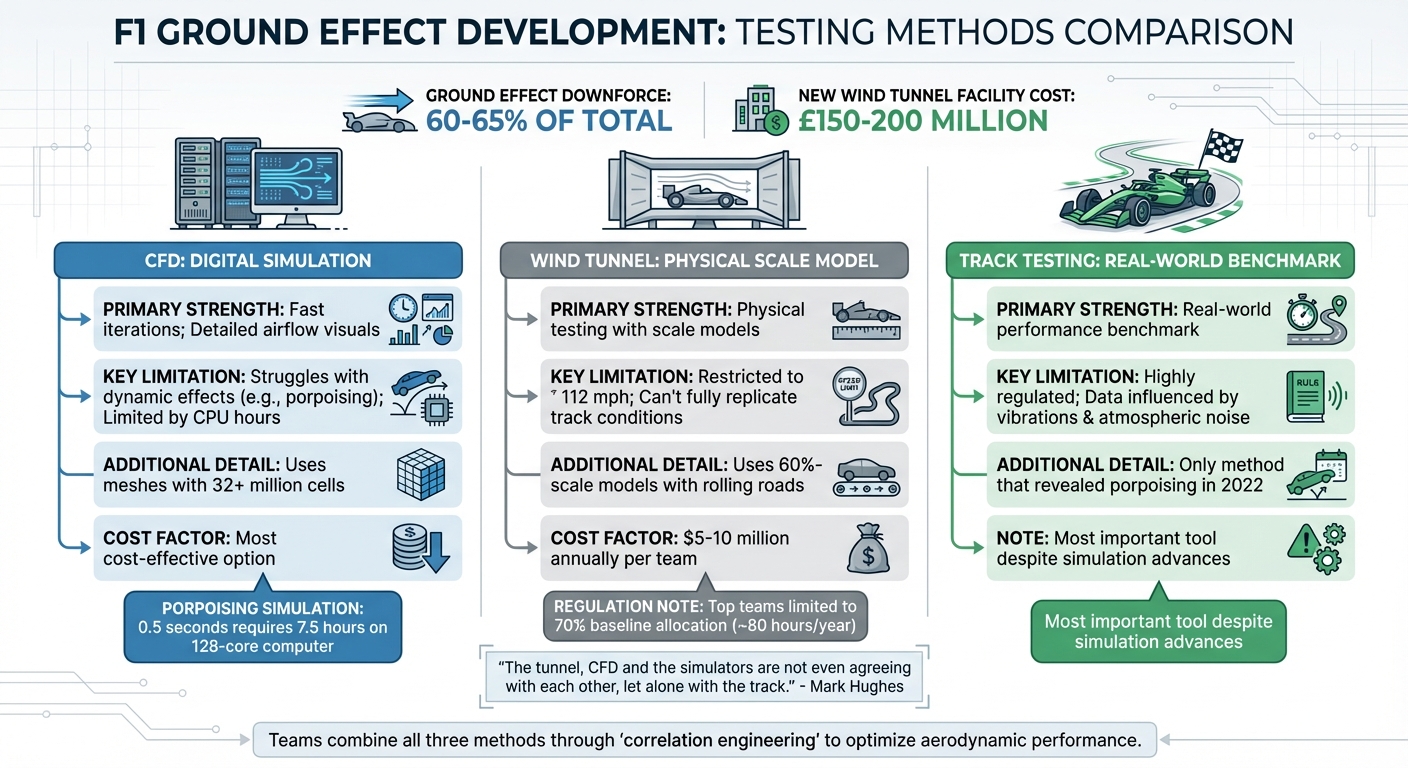
CFD vs Wind Tunnel vs Track Testing in F1: Strengths and Limitations Comparison
Simulation methods, while powerful, often fall short when it comes to replicating real-world performance. This gap is particularly evident in modeling ground effect. Both Computational Fluid Dynamics (CFD) and wind tunnel tests operate under controlled, idealized conditions that don't fully mimic the dynamic nature of actual tracks. A striking example of this occurred during the 2022 Formula 1 season, when teams across the grid failed to predict porpoising - a severe aerodynamic bouncing issue - until cars hit the track. This disconnect highlights a key issue: success in the lab doesn’t always translate to the racetrack.
CFD vs. Wind Tunnel Testing Accuracy
CFD tools are great for creating highly detailed airflow visualizations, essentially acting like virtual sensors for every point in the flow field. They’re also faster and less expensive than wind tunnel tests, making them indispensable for the early stages of car development. However, CFD struggles with the unpredictable dynamics of ground effect, especially in the narrow gaps under the car where 60–65% of downforce is generated.
Wind tunnels, on the other hand, offer a more tangible approach by using scale models. But even they have their drawbacks. Regulatory limits restrict their ability to fully replicate real-world conditions, and their rolling road belts can’t accurately recreate the turbulent boundary layers seen on actual tracks. This mismatch - referred to as the "correlation problem" - is a persistent challenge. As F1 journalist Mark Hughes put it:
The tunnel, CFD and the simulators are not even agreeing with each other, let alone with the track.
Mercedes encountered this firsthand in 2022, when their wind tunnel’s smooth rolling road failed to simulate the track’s rougher surface, leading to a disconnect between their lab results and on-track performance.
| Tool | Primary Strength | Key Limitation |
|---|---|---|
| CFD | Fast iterations; detailed airflow visuals | Struggles with dynamic effects like porpoising; limited by CPU hours |
| Wind Tunnel | Physical testing with scale models | Restricted to 112 mph; can't fully replicate track conditions |
| Track Testing | Real-world performance benchmark | Highly regulated; data influenced by vibrations and atmospheric noise |
These misalignments aren’t just about accuracy - they also significantly affect costs and development timelines.
Computational Costs and Time Requirements
Simulating ground effect is not just a technical challenge; it’s also a financial and time-intensive one. For example, in September 2022, ENGYS CFD Engineer Apostolos Krassas revealed that simulating just 0.5 seconds of porpoising required 7.5 hours on a 128-core computer and a simplified 25-million-cell model. He explained:
To simulate such a complex phenomenon using Computational Fluid Dynamics (CFD) and dynamic mesh deformation techniques is not only technically challenging but could also consume a significant portion of a team's allotted CFD resources.
Wind tunnel testing isn’t cheap either. Teams spend between $5 million and $10 million annually on these facilities. Building new ones is even more costly - Aston Martin recently invested £150–200 million in a cutting-edge wind tunnel and factory setup. Adding to the complexity, the FIA's Aerodynamic Testing Regulations impose strict limits on CFD hours, with lower-ranked teams getting more time to level the playing field.
To navigate these constraints, teams rely on specialized engineers. CFD methodology experts refine numerical models, while aero performance engineers analyze track data to improve the alignment between simulations and actual performance. These efforts are crucial for bridging the gap between theory and reality, even if the road to perfect correlation remains a work in progress.
Conclusion
Simulation tools play a key role in refining ground effect in modern Formula One. Computational Fluid Dynamics (CFD) has become the backbone of development, allowing teams to test and tweak designs quickly without the need for physical prototypes. Wind tunnels, on the other hand, serve as a crucial counterpart, providing real-world validation of these virtual designs under controlled conditions. Together, these methods enable teams to optimize the underbody and rear diffuser, which are responsible for generating 60–65% of a car's downforce. This reliance on virtual testing is shaping a new era of development built around digital-first processes.
The shift toward a virtual-first approach is also being driven by F1's cost cap regulations and the demand for quicker development cycles. Teams are adapting by hiring specialists, such as CFD methodology engineers who refine simulation models and aero performance engineers who ensure virtual findings translate effectively to on-track performance.
The upcoming 2026 regulations will introduce fresh challenges for simulation tools. Active aerodynamics, including adjustable wings, will require engineers to simulate real-time airflow and vortex dynamics. The focus will broaden from maximizing downforce to understanding how aerodynamic balance shifts across varying speeds and car positions. As Adrian Newey explained:
The driver-in-loop simulator is now a far more important development tool than the wind tunnel which... just gives you an output, not any insight.
FAQs
Why is ground effect so sensitive to ride height?
Ground effect depends heavily on ride height because it influences how air flows underneath the car - a key factor in creating downforce. Lowering the ride height speeds up airflow under the car, boosting downforce. On the flip side, even a small increase in clearance slows the airflow, reducing the effect. Teams face the challenge of fine-tuning ride height to get the most downforce possible while avoiding issues like bottoming out or breaking regulations. A poorly adjusted setup can seriously hurt performance.
Why did porpoising surprise teams in 2022?
Porpoising caught teams off guard in 2022, emerging as an unforeseen side effect of the new ground effect regulations. These rules aimed to boost downforce by focusing on the car’s underbody, but they also made cars susceptible to vertical bouncing. This happened because changes in ride height triggered sudden shifts in aerodynamic stability.
While teams relied on CFD simulations and wind tunnel testing, these methods fell short in predicting porpoising accurately. Real-world variables, such as turbulent airflow and delicate aerodynamic balances, proved far more complex to replicate in controlled environments.
How do teams make CFD and wind tunnel data match the track?
Teams bring together CFD (Computational Fluid Dynamics) results, wind tunnel data, and track performance metrics by comparing simulation outcomes to actual measurements gathered during testing. To fine-tune CFD models, they rely on data collected from onboard sensors during track sessions. Similarly, wind tunnel data, though obtained in a controlled setting, is adjusted to better represent track conditions. This back-and-forth process helps account for factors like ground effects and turbulence, making aerodynamic predictions more precise for real-world applications.