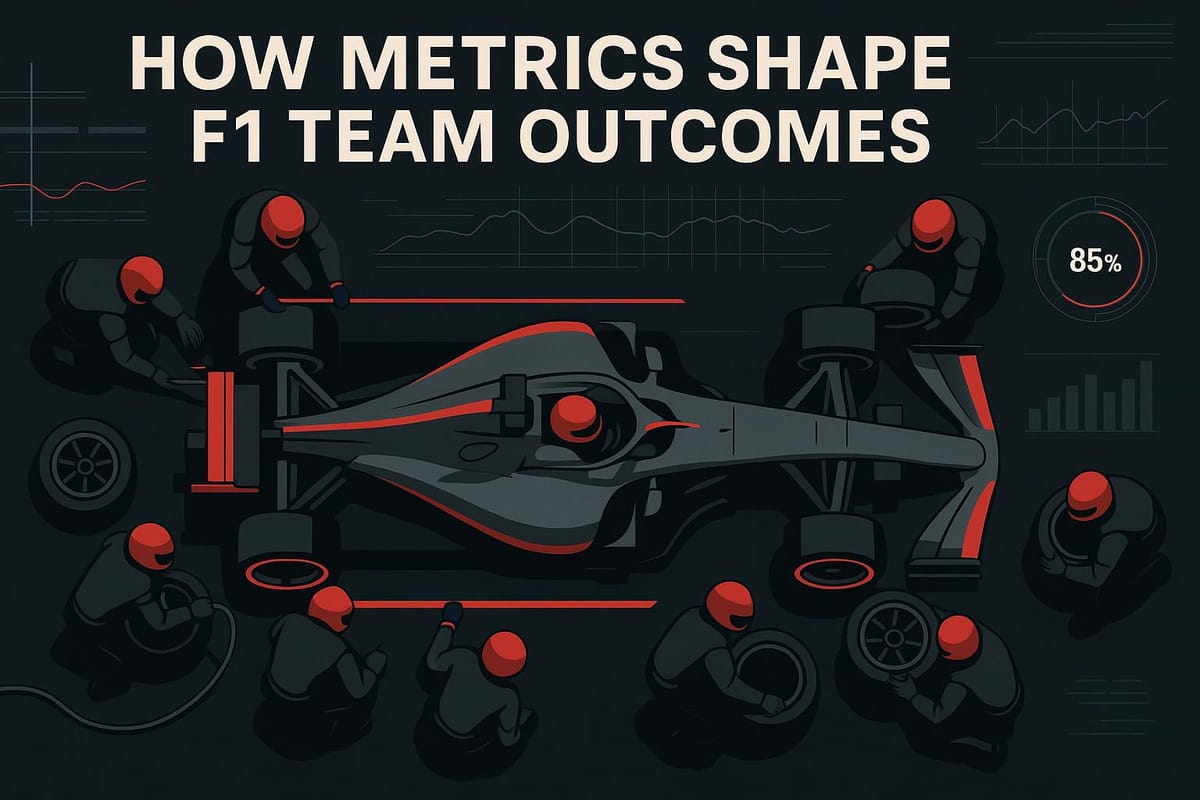
How Metrics Shape F1 Team Outcomes
Integrated car, driver, and pit-crew metrics—aligned with cost-cap efficiency—are the decisive edge that turns F1 telemetry into consistent race wins.
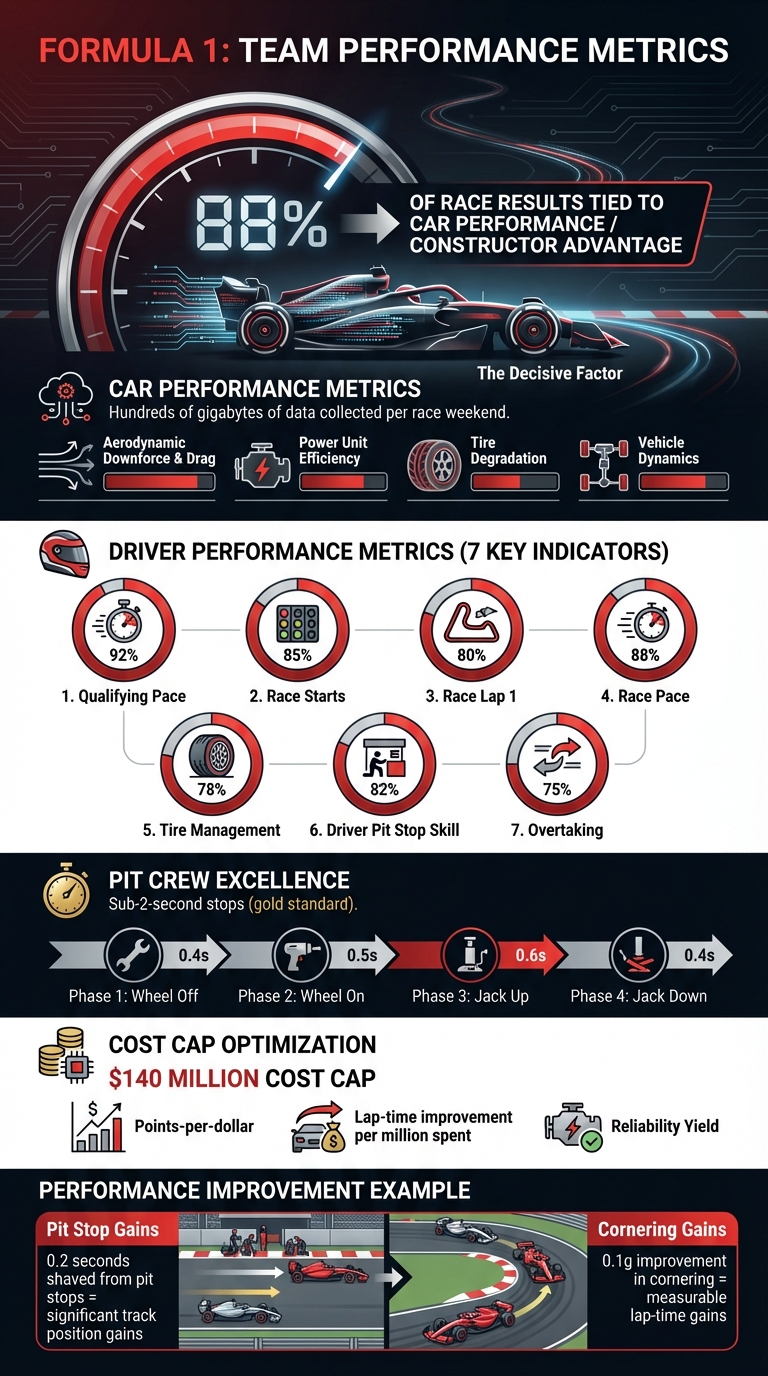
Formula One success hinges on data. Teams rely on metrics to optimize car performance, driver output, and pit crew efficiency, with 88% of race results tied to car performance. However, over-focusing on technical data can create blind spots, neglecting the human and teamwork elements critical for success.
Key takeaways:
- Car Metrics: Aerodynamic downforce, tire degradation, and power unit efficiency are core focus areas.
- Driver Metrics: Performance is evaluated across seven indicators, including Qualifying Pace, Race Pace, and Tire Management.
- Pit Crew Metrics: Sub-2-second stops require precise monitoring of phases like wheel changes and jack movements.
- Unified Systems: Siloed data often causes inefficiencies. Integrating car, driver, and process metrics improves decision-making.
- Cost Cap Optimization: Metrics like points-per-dollar and reliability yield help teams allocate resources effectively.
F1 Team Performance Metrics: Key Data Points and Statistics
Current F1 Metrics: What Teams Measure Today
Car Performance Metrics
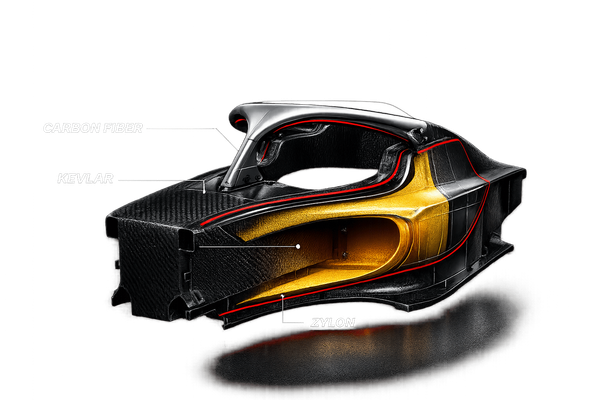
In modern Formula 1, teams gather an astonishing amount of data - hundreds of gigabytes per race weekend - to fine-tune car performance. Key areas of focus include aerodynamic downforce and drag, which are analyzed using computational fluid dynamics (CFD), wind tunnel testing, and on-track pressure sensors. The goal? Striking the perfect balance between cornering grip and straight-line speed. Power unit performance is another critical area, with real-time monitoring of thermal efficiency, fuel flow, energy recovery system (ERS) behavior, and overall power output. This ensures the car operates at peak performance while staying within strict fuel and energy regulations.
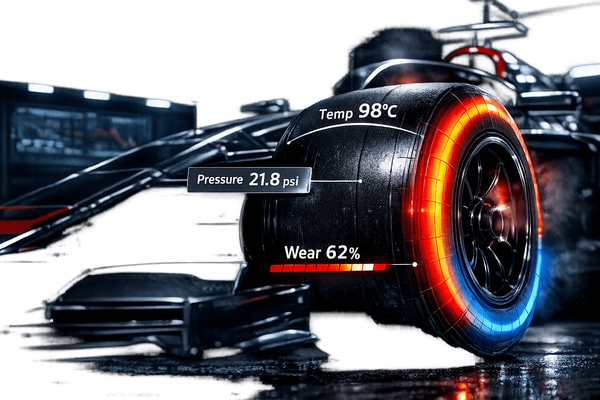
Tires are a cornerstone of race strategy. Teams meticulously track tire degradation, temperatures, pressures, and grip changes to determine the ideal time for pit stops. Meanwhile, vehicle dynamics - such as suspension travel, ride height, brake temperatures, and yaw rates - are closely monitored to adjust car setups for varying track layouts and weather conditions. Together, these metrics provide engineers with a detailed map of performance, influencing both immediate race-day decisions and long-term strategies that directly impact lap times.
Human and Process Metrics
F1 teams don't just measure the car - they analyze the driver, too. Metrics like braking points, throttle timing, and cornering speeds are used to separate driver influence from the car's capabilities. AWS's Driver Season Performance system simplifies this complexity into seven key indicators: Qualifying Pace, Race Starts, Race Lap 1, Race Pace, Tire Management, Driver Pit Stop Skill, and Overtaking. This creates a clear performance scorecard that isolates the driver's contribution from the machine.
Pit crews are scrutinized just as thoroughly. Teams measure total pit stop time and break it down into phases - wheel off, wheel on, jack up, jack down - while analyzing reaction times, precision, and error rates like cross-threaded wheel nuts or unsafe releases. Sub-2-second stops are the gold standard, with sensor data and video analysis dissecting every movement to find areas for improvement. Race engineers and strategists are also evaluated, with metrics like decision-making speed, adherence to pit windows, success rates of undercut and overcut strategies, and the accuracy of race simulations compared to real outcomes. However, the lack of unified systems often limits how effectively these insights are used.
The Problem with Siloed Data
The issue isn't a shortage of data - it's that this data often exists in isolated silos. Aerodynamics teams focus on achieving maximum downforce per wind-tunnel dollar, power unit engineers aim for peak horsepower and thermal efficiency, and strategists base their models on tire degradation projections. These objectives can clash. For instance, an aerodynamic package that increases downforce but also adds drag might perform well in simulations but force the power unit team to adjust fuel mixtures or engine modes, canceling out the theoretical lap time gains.
When driver feedback and simulator data aren't integrated with technical models, teams risk designing cars that perform better in theory than in reality. This disconnect leads to familiar problems: cars that excel in qualifying but falter during races, strategy decisions that fail to account for changing tire behavior, and internal blame games where departments point fingers at one another instead of addressing a misaligned metrics system. Considering that about 88% of race result variance is tied to the constructor, it's clear that teams often over-prioritize car metrics while neglecting softer factors like collaboration, decision-making, and strategic alignment. These gaps highlight the need for a unified approach that bridges technical and human elements, helping teams unlock their full potential.
Solutions: Building a Better Metrics System
Creating Team-Wide Performance Metrics
To truly optimize performance, teams need metrics that work across all departments. A great example is measuring points-per-dollar - calculated as total championship points divided by spending (in millions of dollars under the $140 million cap). This metric provides a clear way to assess return on investment (ROI) across the board.
Another valuable metric is development efficiency. Teams can evaluate how much lap time improvement they achieve per million dollars spent on upgrades, whether it's for a new front wing, floor, or power unit component. By comparing lap times before and after upgrades, teams can identify which projects deliver the best bang for their buck.
Additionally, process reliability metrics help track operational excellence. These metrics might include the percentage of race weekends without major errors (like incorrect tire fits, miscommunications, or unsafe releases) or the average time between critical system failures. Shifting the focus from isolated technical performance (e.g., wind tunnel speed) to resource efficiency and championship points provides a clearer, more actionable picture. These unified metrics lay the groundwork for combining data from technical, human, and process elements.
Connecting Technical, Human, and Process Data
To get the most out of their resources, teams should integrate data from car telemetry, driver behavior, and operational execution into a single performance dashboard. For instance, consider tire degradation - measured as lap-time loss per stint. This can be linked to driver metrics like brake pressure consistency and cornering smoothness, and further connected to process metrics such as pit stop duration and tire change accuracy. The result? A complete picture of how a driver’s tire management can extend stint lengths, reduce pit stops, and improve track position.
The AWS F1 Insights model offers a practical example of this integration. It overlays driver performance data (acceleration, braking, cornering) with car information (downforce, tire temperatures, fuel load) and strategy outcomes (like position changes after pit stops). Multivariate analyses can reveal connections - for example, how a 0.1 g improvement in cornering leads to lap-time gains, impacts tire wear, and reduces pit stop frequency, ultimately influencing race results. When engineers, strategists, and performance coaches share a common data framework, collaboration improves, leading to better team results. Once these integrated data streams are in place, the next step is applying consistent evaluation standards across drivers, pit crews, and strategists.
Setting Standards for Driver, Pit Crew, and Strategy Evaluation
Uniform evaluation frameworks ensure that human and process performance are measured with the same precision as car development. For drivers, a multi-metric scorecard can go beyond lap time to provide a comprehensive view of performance. Key indicators might include:
- Qualifying Pace: The average gap to a teammate in Q3.
- Race Starts: Position changes within the first three laps.
- Race Pace: Average race lap time relative to a teammate, adjusted for fuel and tire conditions.
- Tire Management: Stint length versus simulation expectations.
- Pit Stop Skill: Consistency in pit lane entry speed and braking points.
- Overtaking: Success rate for passes, adjusted for factors like DRS and track position.
Weighting these metrics - placing more emphasis on Race Pace and Qualifying Pace, for example - can produce a season-long performance score. This score can be used for objective contract discussions and targeted coaching.
Pit crews also need detailed evaluation. Metrics like average pit stop duration, consistency (measured by standard deviation), and error rates (e.g., incorrect tire fits or wheel nut issues) provide actionable insights. Even minor improvements - like shaving off 0.2 seconds from a pit stop - can make a huge difference in maintaining or gaining track positions.
For strategists, metrics like strategy win rate (how often their chosen strategy outperforms alternatives), pit stop timing accuracy (how closely stop windows match optimal predictions), and safety car response effectiveness (net position changes during safety car periods) can turn strategy into a measurable, data-driven skill. This approach ensures consistent decision-making, ultimately driving better championship outcomes.
Putting Metrics into Practice for Long-Term Success
Using Metrics to Allocate Resources Under the Cost Cap
With the $140 million cost cap in place, Formula 1 teams face the challenge of squeezing the most lap-time gains out of every dollar spent. To do this, many teams treat development like managing an investment portfolio. They measure performance-per-dollar or lap-time-per-engineering-hour across key areas like aerodynamics, mechanical upgrades, power unit refinement, and operational enhancements.
Teams have honed resource allocation strategies that directly tie spending to lap-time improvements. For instance, simulation accuracy metrics - which measure the gap between predicted and actual stint degradation or fuel consumption - help teams streamline testing and refine race strategies, reducing waste. Similarly, reliability yield metrics track subsystem failures per 1,000 kilometers and calculate points lost due to DNFs or penalties. This data helps teams decide whether investing in reliability offers better returns than chasing raw speed. For example, if aerodynamics are performing well but time is lost due to slow pit stops or tire overheating, reallocating budget from risky aero updates to pit crew training or tire modeling can often deliver better results.
This careful balancing of resources sets the stage for integrating human expertise into the decision-making process.
Combining Numbers with Human Judgment
While metrics provide a solid foundation, human judgment is essential to adapt strategies to real-world conditions. For instance, race simulations might suggest an aggressive two-stop strategy based on tire degradation data and safety car probabilities. However, experienced strategists might override this if they anticipate track position being unusually critical at a specific circuit. Similarly, driver telemetry might show slower corner speeds, but engineers also weigh qualitative feedback about car balance, traffic, or a driver’s confidence after a recent incident before making setup changes.
Take McLaren’s analysis of Jenson Button as an example. His ability to outperform teammates by 0.2 seconds per lap in mixed conditions was attributed to his exceptional brake control. This insight became a benchmark for evaluating and developing drivers. However, it wasn’t just about the numbers - it worked best when paired with coaching sessions and simulator work that addressed the human side of performance.
Metrics also help refine crew strategies by monitoring workload and error rates. For example, operational mistakes like mis-torqued wheels or setup errors often correlate with fatigue. This data leads to policies such as mandatory rest days after heavy travel schedules, rotation systems for trackside staff, and limits on overnight shifts during intense development periods. By postponing low-impact upgrades or shifting tasks to simulations, teams can avoid costly errors that might undo any small gains.
Regular Reviews to Keep Metrics Relevant
Metrics that are effective early in the season can lose their relevance as regulations evolve, car designs change, and the competitive landscape shifts. To stay ahead, teams need structured review processes. Post-session and post-race reviews help refine micro-metrics like tire warm-up targets, pit stop procedures, or fuel-saving benchmarks. Monthly or development-cycle reviews focus on broader engineering KPIs, such as aero correlation scores, CFD/wind tunnel efficiency, and the success rate of upgrades in delivering expected lap-time gains.
Mid-season and post-season reviews take a higher-level view, analyzing how car performance, driver skill, and operational efficiency contribute to results. These reviews also adjust KPI priorities, especially when new regulations - like aero testing restrictions or power unit rule changes - come into play. Without these periodic reviews, teams risk optimizing for outdated goals.
A cross-functional committee should oversee the KPI framework, ensuring that each metric has a clear owner responsible for data accuracy, interpretation, and action plans when thresholds are breached. Every review should result in immediate adjustments to development plans, procedures, or staffing, with follow-ups to confirm whether the changes improved the targeted metrics.
F1 Explained: How Does Telemetry Data Help Teams Go Faster?
Conclusion: Metrics as a Competitive Edge
In Formula One, where roughly 88% of race outcomes hinge on constructor advantage, a well-designed metrics system can turn raw potential into lasting success. By combining technical expertise, driver skill, and operational precision through integrated data, teams can uncover hidden inefficiencies and make smarter decisions - all while staying within the cost cap. When telemetry data, driver performance evaluations, pit-crew timing, and strategic decisions are viewed as a unified whole, teams gain a clearer picture of where improvements can be made.
The most competitive teams don’t just collect data - they use it as a guide for action. Their systems inform decisions on everything from car setup and staffing to training and budgeting, constantly refining KPIs and blending data with expert judgment. For example, measuring a car’s potential versus its actual performance, analyzing tire efficiency based on design and driver input, and assessing the full impact of pit stops can turn small improvements into podium finishes.
Looking ahead, teams must remain flexible as regulations and technologies evolve. With the 2026 power unit changes and cost-cap adjustments on the horizon, new metrics - like those tracking sustainability, budget efficiency, and performance per dollar spent - will become increasingly important. Teams that regularly update their metrics during technical debriefs will ensure their strategies stay aligned with what truly impacts race-day results. These adaptive reviews not only enhance performance but also provide deeper insights for fans and analysts alike.
For those curious about the finer details, F1 Briefing offers in-depth analysis of telemetry, strategy models, and cost-cap trade-offs. It’s a great resource for understanding how tire data, pit-stop efficiency, and driver metrics contribute to consistent success.
The bottom line? A unified metrics system is the secret weapon that turns incremental improvements into consistent race-day success. By transforming raw data into actionable strategies, teams can make informed decisions that keep them ahead of the competition.
FAQs
How do F1 teams use performance metrics to improve decision-making?
Formula One teams depend on a mix of car performance, driver input, and operational data to make smarter choices both on and off the track. This data includes details about tire wear, fuel usage, aerodynamics, and driver performance. By breaking down this information, teams can fine-tune their strategies, tweak car setups, and adjust race tactics in real time.
Take telemetry data, for instance - it reveals how the car is performing during a race, offering crucial insights into its behavior. On the other hand, driver feedback adds a human perspective, helping refine overall performance. Then there are process metrics, like the precision of pit stops, which ensure no valuable seconds are wasted. When combined, these metrics give teams a well-rounded view, helping them stay competitive and adapt to rapidly changing race-day conditions.
What challenges arise when F1 teams rely too heavily on technical data?
While technical data plays a central role in Formula One, leaning too heavily on it can sometimes backfire. Teams that focus exclusively on numbers risk sidelining crucial human elements like a driver's intuition, adaptability, and ability to make split-second decisions during a race. These instinctive reactions, shaped by experience, can often be the deciding factor in critical moments.
Relying too much on data can also bog down decision-making, particularly in high-pressure situations where speed is everything. In a sport as fast and unpredictable as Formula One, blending data-driven strategies with human judgment is essential to stay ahead of the competition.
How does the F1 cost cap impact how teams allocate resources?
The F1 cost cap has become a game-changer in how teams manage their finances and resources. Designed to create a more level playing field, it sets a strict limit on how much teams can spend on areas like car development, operations, and staffing. This means teams have to focus on being efficient and make tough calls about how to allocate their budgets.
Take, for instance, the balancing act teams face: they need to divide their spending among aerodynamics, engine performance, and race strategies in a way that boosts performance without breaching the cap. For smaller teams, this system is a lifeline, giving them a chance to compete against larger teams that once had significantly bigger budgets. In the end, the cost cap pushes for smarter spending and brings tighter competition to the grid.