Deep Learning in F1 Lap Time Forecasting
Deep learning improves F1 lap forecasts most when models use tire, fuel, and track context—rare events still need engineers.

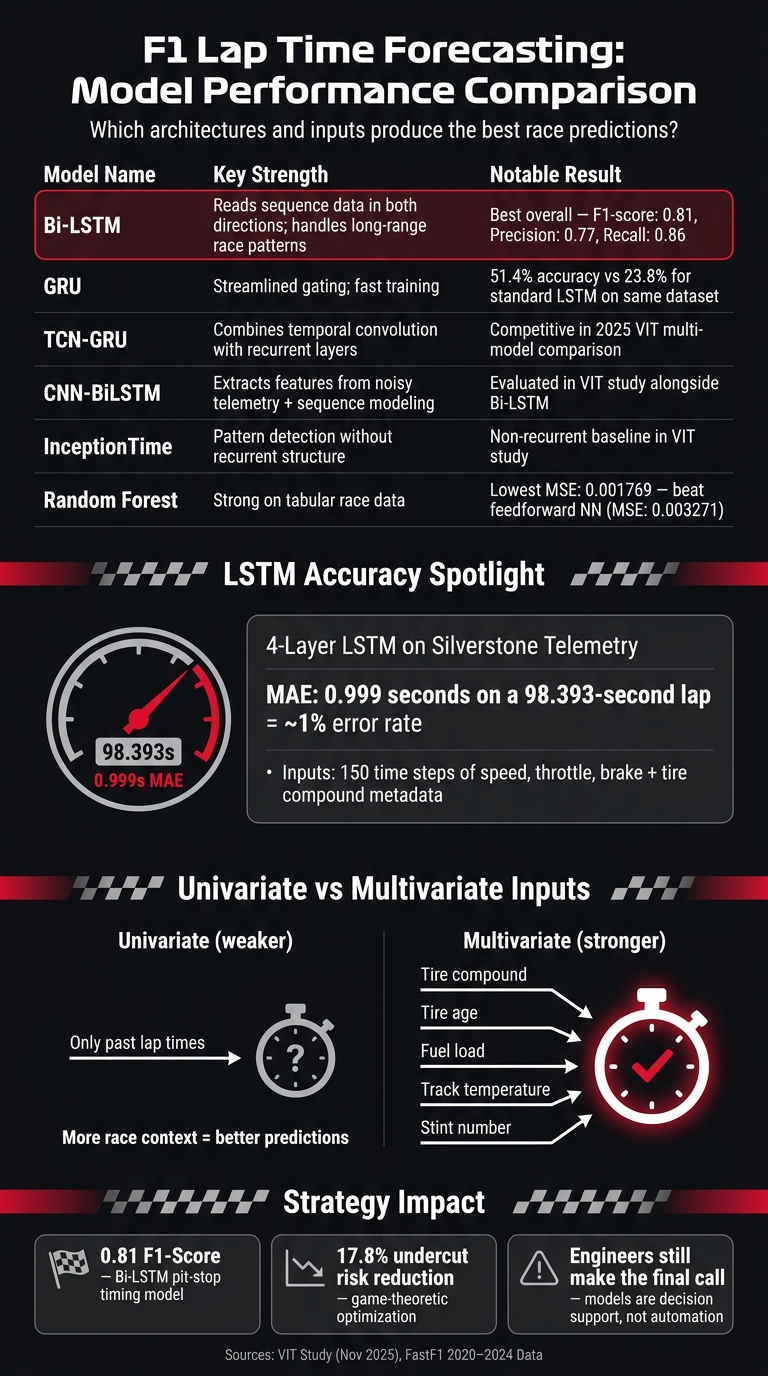
If you want the short answer: deep learning helps most when it uses race context, not just old lap times. In the studies covered here, models that used inputs like tire age, fuel load, stint data, and track temperature beat simpler one-variable setups more often, while Bi-LSTM stood out in one 2025 comparison with 0.77 precision, 0.86 recall, and a 0.81 F1-score.
Here’s the main point in plain English:
- Lap time prediction is a race tool, not just a stats task
- Fuel burn and tire wear pull pace in opposite directions
- Sequence models like LSTM and Bi-LSTM fit lap-by-lap data better
- Multivariate models beat univariate models because race pace depends on more than timing history
- Deep learning does not win every test; in one study, Random Forest beat a feedforward neural net on MSE
- Dry, stable stints are easier to model
- Safety Cars, VSCs, weather shifts, dirty air, and missing data still cause problems
- Teams can use these forecasts for pit windows, tire life, undercuts, and stint length, but engineers still need to make the final call
One result shows the trade-off well: a 4-layer LSTM on Silverstone telemetry reached 0.999-second MAE on a 98.393-second lap, or about a 1% error. That is close enough to help with race calls, but not enough to hand full control to a model.
Below, I break down what the research says, where the models did well, where they missed, and what that means for race-day decisions.
Deep learning approaches used for F1 lap time forecasting
Deep Learning Models for F1 Lap Time Forecasting: Performance Comparison
How LSTM models handle sequential race data
Lap times don’t happen in isolation. One lap is tied to the ones before it, which is why LSTMs make sense for race forecasting. They can keep track of earlier laps while learning how pace shifts across a stint.
Standard recurrent neural networks tend to lose older information as sequences get longer because of the vanishing gradient problem. LSTMs were built to deal with that issue, so they’re a better match for forecasting lap times over a run of laps.
A close cousin, the Bidirectional LSTM (Bi-LSTM), reads sequence data in both directions. In a November 2025 study that used FastF1 data from the 2020–2024 seasons, the Bi-LSTM came out on top among the tested models. It posted a precision of 0.77, a recall of 0.86, and an F1-score of 0.81.
That point matters. Forecast quality isn’t just about the model itself. It also depends on the race signals the model can pick up.
Univariate vs. multivariate forecasting setups
A univariate setup looks only at past lap times. A multivariate setup adds race context, such as tire compound, tire age, fuel load, and track temperature. Studies show that adding this context improves forecasts.
So the comparison isn’t only which model wins. It’s also whether the model gets a bare timing history or a richer picture of what’s happening in the race.
Other neural network architectures used as comparison baselines
Researchers didn’t test LSTMs by themselves. The Vellore Institute of Technology study also compared TCN-GRU, GRU, InceptionTime, and CNN-BiLSTM against Bi-LSTM. Results shift based on both the architecture and the input set.
| Architecture | Key Strength | Notable comparison from the studies |
|---|---|---|
| Bi-LSTM | Models temporal dependencies in both directions and handles long-range race patterns well | Top performer in the Vellore study, with an F1-score of 0.81 |
| TCN-GRU | Combines temporal convolution with recurrent layers for sequence modeling | Included in the same November 2025 comparison study |
| GRU | Streamlined gating mechanism; can sometimes beat standard LSTMs on accuracy | In one comparative study, it reached 51.4% accuracy versus 23.8% for a standard LSTM on the same dataset |
| CNN-BiLSTM | Combines feature extraction from noisy telemetry with sequence modeling | Evaluated alongside the other architectures in the VIT study |
| InceptionTime | Finds patterns in raw telemetry without a recurrent structure | Used as a nonrecurrent comparison model |
| Standard MLP/FFNN | Common baseline for comparison | Often struggles with sequential dependencies like tire degradation |
Model choice matters, but input data and scoring rules matter just as much. The next section looks at which data sources and error metrics these studies used to measure those gaps.
sbb-itb-7c68254
Data sources, model inputs, and how studies measured accuracy
Key inputs: timing data, tires, fuel, and track conditions
Model design matters, but the part that often makes or breaks a forecast is the data going in and the way the study checks its results.
Across recent studies, the same inputs show up again and again: tire compound, tire age, stint number, fuel load, and track temperature. That makes sense. Tires wear down, fuel burns off, and track temperature can change grip from one stint to the next.
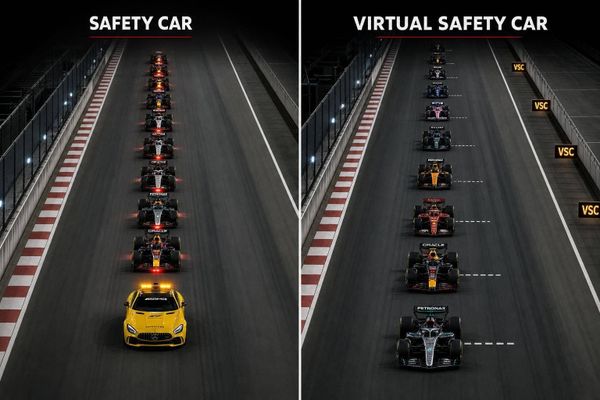
Race context matters too. Caution periods, Safety Cars, and Virtual Safety Cars can swing lap times hard, which makes them tough to model in a clean way. Track position also changes things. Clean air can help a driver settle into a steady pace, while dirty air can hurt lap-time consistency.
Still, none of those inputs mean much unless studies test them with clean train-test splits and error metrics that match what teams care about on race day.
How studies split data and measured forecast error
Most studies use a 70/30 or 80/20 split. Many also use temporal splits so the model doesn't learn from future races by accident. That's a big deal. If race data leaks across the split, the accuracy can look better than it is.
One clear example comes from a November 2025 Vellore Institute of Technology study. Its Bi-LSTM model trained on FastF1 data from 2020–2024, then used the final eight 2024 races as the holdout set.
For regression tasks, studies usually report MAE and RMSE. MAE below 1.0 second points to sub-second accuracy. In racing, that gap is small on paper but huge in practice, because strategy calls often come down to tiny timing differences. RMSE is also useful because it hits large misses harder, which helps expose weak spots during messy race phases like Safety Cars and pit stops.
For classification tasks, such as pit stop timing, studies shift to Precision, Recall, and F1-score. One Bi-LSTM study reported precision of 0.77, recall of 0.86, and an F1-score of 0.81.
Study comparison table
| Study / Model | Primary Input Variables | Dataset Scope | Key Result | Main Limitation |
|---|---|---|---|---|
| LSTM (multivariate) | Fuel load, tire degradation, track temperature | Multiple GPs (FastF1) | Captures long-term dependencies | Missing track-evolution signals |
| Random Forest | Circuit ID, lap number, pit indicators, lag features | Kaggle F1 Dataset | Lowest MSE at 0.001769, ahead of XGBoost (0.001824) and LightGBM (0.001955) | Lacks deep temporal context for sequential degradation |
Key findings and remaining limits in the research
Where deep learning outperformed simpler baselines
The gains are real, but they show up most when the model has enough race context to work with. Recent studies point in the same direction: richer context leads to better lap-time forecasts, especially later in a stint when tire wear and pace drop-off start to matter more.
One strong example comes from a 4-layer LSTM trained on Max Verstappen's 2021–2025 Silverstone telemetry. It used 150 time steps of speed, throttle, and brake data, along with tire compound metadata, and reached an MAE of 0.999 seconds on a 98.393-second lap. That's about a 1% error rate.
That said, deep learning doesn't beat simpler models across the board. In one study, Random Forest recorded an MSE of 0.001769, while a feedforward network came in at 0.003271. So this isn't a case where neural networks win by default. LSTMs tend to make the most sense when the data changes over time and sequence matters - like stint progression, tire drop-off, and lap-by-lap pace shifts.
Why domain knowledge still shapes model quality
The input features do a lot of the heavy lifting. If the wrong signals go in, the model may end up tracking noise instead of race behavior. That's why studies keep coming back to variables like tire compound, stint age, fuel load, and track temperature. Those factors are tied directly to lap time changes on track.
A November 2025 VIT Bi-LSTM study makes that point pretty clearly. The researchers left out intermediate and wet tire data on purpose because those conditions were too erratic for the model's current strategy patterns. That choice says a lot: machine learning is being used as decision support, not as a stand-in for race engineers. Human judgment still sets the boundaries of what the model can learn well - and where it starts to struggle.
Main weaknesses: safety cars, weather shifts, and hidden variables
LSTMs work best in stable, dry stints. Once a Safety Car comes out or the weather turns fast, the patterns become much harder to read, and model performance drops. Many studies deal with that by removing those race phases during preprocessing. It helps keep the error numbers lower, but it also means the model learns less from the most chaotic parts of a race.
Some variables are also hard to model because the data just isn't public. Dirty air and hidden fuel-burn rates are two big examples, since teams don't release those values. On top of that, about 1.68% of lap-time data is missing or corrupted because of sensor transmission errors, so studies fill those gaps with KNN imputation.
What this research means for race strategy and future work
Strategy use cases: pit windows, tire life, and stint planning
When a team can forecast pace with confidence, that forecast stops being a nice chart on a screen and starts turning into race decisions. On the pit wall, lap time forecasts help crews judge pit windows, estimate tire drop-off, and measure undercut potential. They also let teams run full strategy scenarios to see which path is most likely to produce the lowest total race time. Recent research puts that idea to work in pit-timing models.
A 2025 Bi-LSTM pit-stop model reached 0.77 precision and 0.86 recall, which gives strategists a practical timing reference. On top of that, game-theoretic optimization built on similar models cut undercut risk by 17.8%. In a sport where track position can decide everything, that kind of margin matters.
VSC periods make this even more important. A borderline pit call can swing from “stay out” to “box now” because pit-lane time loss drops fast under a VSC. So if one is deployed, the model has to recalculate stint length right away. Still, even strong models need guardrails.
What teams and analysts need to keep in mind
These systems should tighten the decision range, not take the place of human judgment. They do their best work in stable stints, where the race follows a more normal pattern. Rare events are different. That’s where engineers still need to step in.
Future work should push on a few areas:
- multivariate inputs
- better treatment of rare events
- track evolution
- dirty air
That leaves a pretty clear workflow: model the most likely pace, then let engineers decide whether the edge is big enough to act on.
Conclusion: Main takeaways from current F1 lap time forecasting research
The core point is straightforward: better inputs lead to better race calls, but rare events still put a ceiling on full automation. Multivariate models beat univariate ones because race pace comes from several variables working together, not just one. The biggest gains still come from richer inputs and stronger handling of safety cars, weather changes, and track evolution. Engineers still make the final call.
FAQs
Why do multivariate models predict lap times better?
Multivariate models predict Formula 1 lap times with more accuracy because they account for the messy, non-linear relationships between telemetry, weather, and race-day variables.
A univariate model looks at only one thing: past lap times. That can help, but it misses a big part of the picture.
A multivariate model pulls in several inputs at once, such as:
- fuel load
- tire wear
- brake pressure
- throttle input
- track temperature
That matters in Formula 1, where lap time shifts constantly as the car gets lighter, the tires lose grip, and the track changes through a stint. By using more than one input, these models do a better job of showing how driver actions and changing conditions shape performance.
How useful is a 1-second lap time error in race strategy?
In Formula One, a 1-second miss in lap time forecasting is huge. Teams chase gains measured in tiny fractions, so being off by that much can make a prediction far less useful.
That kind of error can trigger a pit stop at the wrong moment and cost several positions. On the flip side, accurate real-time predictions can help lock in track position, and even one spot in the standings can be worth about $10,000,000.
Why are Safety Cars and weather changes so hard to model?
Safety Cars and weather shifts create extreme volatility that can throw off standard predictive models. They add dynamic, non-linear variables that don’t follow normal race-pace patterns.
Weather can change in a flash. Track temperature moves, rain starts or stops, humidity shifts, tires behave differently, and grip can disappear almost overnight. Most models lean on patterns from telemetry and past data, so these sudden, high-impact events can make standard statistical assumptions unreliable.