F1 Net Zero 2030: Logistics Progress Check
The sport's logistics show cuts from HVO100 trucks and sea rotation, but air freight, limited SAF and data gaps threaten Net Zero 2030.
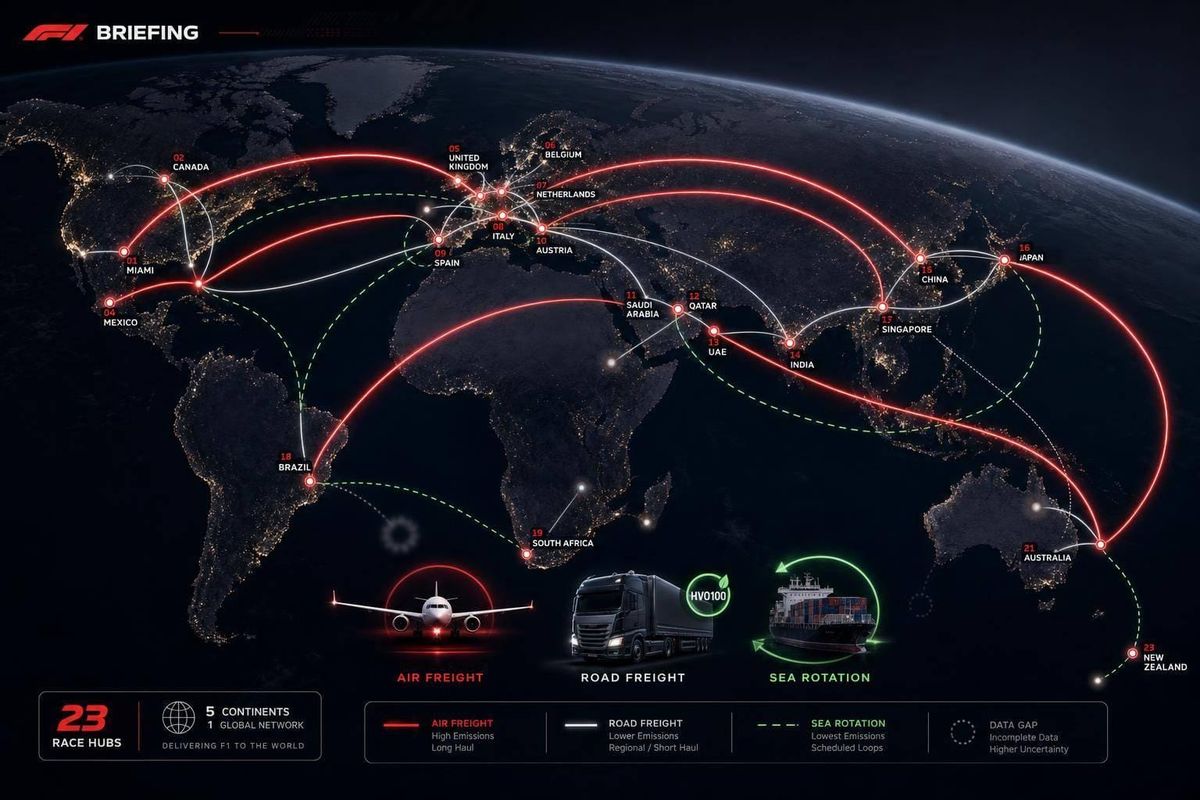
F1 is making progress, but it is not yet showing enough proof that logistics cuts will reach the 2030 goal. From a 2018 baseline of 256,000 tons of CO2e, the sport got down to 223,031 tons by 2022, a 13% drop. That is still far from the 50% absolute cut F1 says it wants by 2030.
If I boil the article down, the picture is simple:
- Road freight in Europe looks strong, with 83% to 89% lower emissions from HVO100 truck use.
- Air freight is still the main problem, even with B777 freighters, 20% SAF use on non-European cargo flights, and fewer bad calendar jumps.
- Sea freight use is up because teams now rotate five to seven equipment sets, which gives more cargo time to move by ship.
- Remote support is growing, which should cut travel, but public numbers still do not show the full effect.
- The biggest issue is data: there is not enough public detail by race, team, supplier, or fuel batch to prove the full path to 2030.
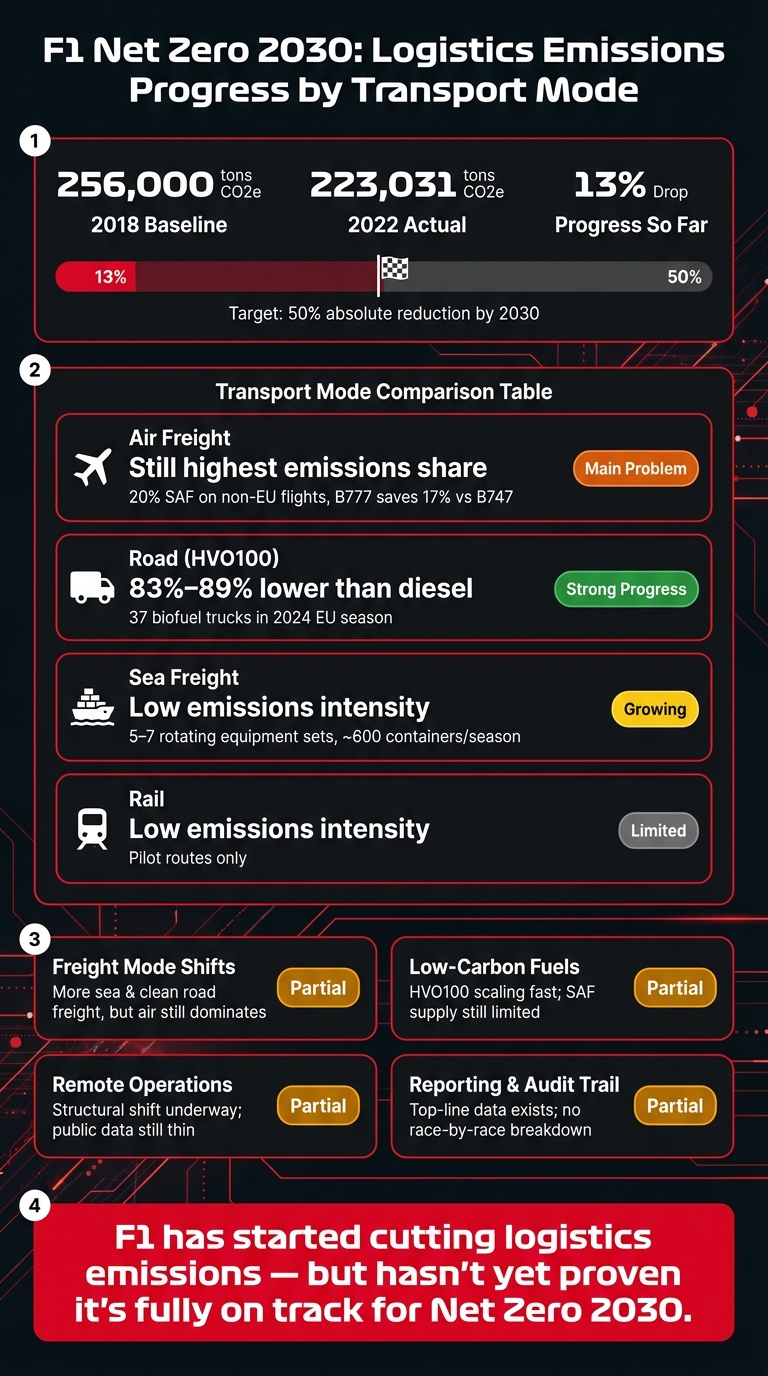
F1 Net Zero 2030: Logistics Emissions Progress by Transport Mode
Can Formula 1 really become sustainable? The 2026 fuel and logistics debate
sbb-itb-7c68254
Quick Comparison
| Area | What looks good | What still limits progress | Verdict |
|---|---|---|---|
| Freight mode shifts | More sea freight, cleaner European trucking, better aircraft | Air freight still carries a big share | Partial |
| Low-carbon fuels | HVO100 use in Europe, some SAF use | SAF supply is limited; some savings rely on certificates | Partial |
| Remote work and travel cuts | More off-site logistics, broadcast, and engineering support | Travel-cut data is still thin | Partial |
| Reporting and audit trail | Top-line emissions data exists | No race-by-race or team-by-team public breakdown | Unclear |
My takeaway: the article shows real movement in the right direction, but the hardest cuts are still tied to long-haul freight and travel. So if you want the short answer, it is this: F1 has started to cut logistics emissions, but it has not yet shown enough hard public evidence to say it is fully on track for Net Zero 2030.
Checklist 1: Freight Mode Shifts and Calendar Design
Air, Road, Rail, and Sea: Where Mode Shifts Are Working
F1 is cutting freight emissions by matching cargo to the right transport mode. Air freight still handles race-critical and broadcast gear that has to arrive fast. But for freight that can wait, the shift is already happening.
The clearest example is on European routes. During nine European rounds in the 2023 season, DHL used 18 HVO100-powered trucks and moved about 300 tons of freight per race. That led to an average 83% cut in road freight emissions compared with a diesel fleet. Mercedes-AMG PETRONAS F1 pushed this further in the 2024 European season. Its trucks each covered about 9,000 to 10,000 kilometers and delivered an 89% overall reduction in freight emissions for that stretch of the calendar.
Another big change is how teams move bulky equipment. Teams now use five to seven identical equipment sets that rotate between races. That setup gives hospitality units, marketing assets, and heavy garage tools enough time to move by container ship instead of by air. DHL handles between 60 and 120 containers per race, or about 600 containers over a full season.
F1 has also made changes in the air. Moving from Boeing 747 aircraft to Boeing 777 freighters cut flight emissions by 17%. And 20% of cargo flights to races outside Europe now use Sustainable Aviation Fuel, or SAF, through DHL's GoGreen Plus service. DHL projects that this will save about 4,500 tons of carbon in 2024.
| Transport Mode | Lead Time | Emissions Intensity | Key Lever in F1 |
|---|---|---|---|
| Air Freight | Days | Highest | B777s + 20% SAF |
| Sea Freight | Weeks | Low | 5–7 rotating sets; ~600 containers/season |
| Road (HVO100) | Days to weeks | Low | 83%–89% lower than diesel; standard on European legs |
| Rail | Medium | Low | Limited to pilots on selected routes |
Rail is still the outlier here. It remains limited to pilot use on a small number of European routes.
And that's the catch: mode shifts only help when the schedule gives freight enough time to move that way.
Calendar Changes That Cut Freight Miles
Calendar design has a direct effect on freight emissions. If races are grouped by region, more cargo can move by sea or road. If the schedule jumps across continents, air freight takes over.
F1 has started to lean into regional grouping. Clusters of about four races in the Middle East, four in Asia, and four in the United States give DHL more room to plan cleaner routes between events. That cuts some of the intercontinental back-and-forth that tends to push freight onto planes.
"The regionalisation of the calendar – we have four races in the USA, four in the Middle East, four in Asia - that helps us choose the best routes between all of those." - Paul Fowler, Head of DHL Motorsports Logistics
You can see the shift pretty clearly:
| Calendar Feature | Pre-2023 Calendar | 2024–2026 Calendar | Logistics Impact |
|---|---|---|---|
| Race Sequencing | Frequent intercontinental jumps | Regional clusters in the Middle East, Asia, Europe, and the Americas | Reduced total freight miles and backtracking |
| Transport Mode | Heavy air freight reliance across most kit types | Sea freight for slow sets; HVO100 truck fleets for Europe | Lower emissions per ton-mile for non-time-critical cargo |
| European Trucking | Standard diesel fleets | HVO100 biofuel fleets | 83%–89% reduction in road freight emissions |
Still, logistics doesn't get the final word. Weather, host-country preferences, and broadcaster demands can all force awkward race sequencing and extra long-haul moves.
Rating: Partial. The mode shifts are real, and the numbers back them up. European road freight has changed a lot, and sea freight rotation is doing meaningful work. But air freight still carries much of the load for flyaway races, SAF covers only 20% of non-European flights, and rail is still in pilot mode. The calendar is moving in a better direction, though outside pressures still limit how much routing can be cleaned up.
Checklist 2: Low-Carbon Fuels and Freight Asset Efficiency
SAF in Air Freight and HVO100 in European Trucking
F1 logistics now runs on two different fuel paths. Road freight is moving ahead faster. Air freight is still more constrained. Once freight is routed more efficiently, the next step is simple: what powers the trucks and planes that are still needed?
On the road, HVO100 is already cutting emissions at scale. DHL grew its biofuel-powered truck fleet from 19 trucks in 2023 to 37 in 2024 for the European season.
Air freight is a slower story. SAF covered 20% of cargo flights to races outside Europe through DHL's GoGreen Plus service, with a target of 4,500 tons of carbon savings in 2024. But there’s a catch. A meaningful share of that progress still comes from book-and-claim certificates, not from physical SAF being loaded onto every aircraft. Mercedes says SAF certificates covered about 68% of its flight emissions, equal to nearly 9,860 tons of CO2e.
Here’s the split:
| Fuel Type | Conventional Option | Low-Carbon Alternative | Emissions Reduction | Key Caveat |
|---|---|---|---|---|
| Aviation | Jet A/A-1 | Sustainable Aviation Fuel (SAF) | Up to 80% | Limited physical supply; often managed through book-and-claim certificates |
| Road Freight | Standard diesel | HVO100 biofuel | 83%–89% | Primarily viable for European legs; requires compatible engine technology |
Road fuel is scaling faster than SAF. HVO100 is already in use at scale in European trucking, while SAF still runs into cost issues and limited physical supply.
Containers and Lighter Freight Setups
Fuel is only part of the picture. F1 is also cutting the amount of freight it has to move in the first place. That matters because lighter, tighter freight setups make every fuel switch go further.
B777 freighters cut emissions by 17% versus B747s. On the ground, teams now use five to seven identical equipment sets that rotate around the world, and the sport moves about 600 shipping containers per season, with 60 to 120 containers per race depending on the venue. That opens the door for more freight to go by sea instead of by air.
The sticking point is marine fuel. Sustainable options are still hard to get across shipping carriers.
Rating: Partial. HVO100 on European roads is delivering verified, large-scale cuts. SAF is legitimate, but physical coverage is still limited and part of the math depends on certificate accounting. Asset-efficiency moves like the B777 shift and sea-freight rotation are helping too. The main bottlenecks are SAF supply, marine fuel access, and the cost of scaling all of this.
Checklist 3: Remote Operations and Reduced Travel Demand
Remote Broadcasting, Engineering Support, and Centralized Operations
Fuel savings only go so far if large teams still fly to every race. That’s why F1 has moved more broadcast, engineering, and logistics work off-site. The aim is simple: reduce the number of people at the circuit, which also cuts staff travel and some of the freight tied to those crews.
DHL’s motorsport setup shows what that looks like in practice. It has 100 logistics specialists, but only 50% now work on-site during race weekends. The other half supports operations remotely.
How Much Travel Has Been Avoided
F1 cut its total footprint by 13% from 2018 to 2022, even with a bigger race calendar. But public reporting still doesn’t break out how much of that drop came from remote operations and how much came from cleaner facility energy.
What we do know is where the biggest emissions come from. Business travel makes up 29% of F1’s total emissions, and logistics makes up 49%. Put those together, and you get 78% of the sport’s footprint. That’s why remote operations matter so much: they can reduce both travel and logistics demand at the same time. Still, if the numbers aren’t tracked in detail, it’s hard to tell how much change is coming from each move.
Mercedes-AMG PETRONAS F1 reported a 35% drop in "Race Team Control" emissions in 2024 compared with a 2022 baseline. That’s a good sign, but it still doesn’t separate the effect of remote work by itself.
| Function | Historical On-Site Model | Current Remote-Supported Model |
|---|---|---|
| Broadcast Production | Full on-site production gallery and crew at every circuit | Significant portion handled at remote Media & Technology centers |
| Logistics Management | Entire specialist team traveling to every race | 50% on-site; 50% remote support |
| Engineering Support | Large trackside data and telemetry teams | Increased factory-based workflows and remote data analysis |
| Staff Travel | High-volume business travel across all roles | Targeted for reduction; still 29% of total footprint |
The shift is real, and it looks structural rather than cosmetic. But the public accounting still has gaps. F1 does not yet publish enough function-by-function data to show how many flights were avoided, how much equipment stayed home, or how much CO2e was cut.
Rating: Partial. The move to remote and hybrid staffing is clear, but the public data still isn’t detailed enough to verify the full travel-reduction story.
Checklist 4: What the Data Shows, What It Misses, and the 2030 Outlook
Reported Progress vs. the 2030 Logistics Target
The earlier checklists show what has changed. This section looks at something tougher: whether those gains are big enough to get F1 to 2030.
F1's emissions fell 13% from 2018 to 2022, even with a larger calendar. That's solid progress. But there's still a big distance between a 13% cut and the 2030 target of a 50% absolute reduction. And that's the sticking point. The public data shows movement in the right direction, but it doesn't yet show, with enough detail, that these cuts can scale far enough.
Data Gaps That Block a Full Logistics Audit
Three missing pieces make a full verdict hard.
First, there is no public emissions breakdown by individual race or by team. That makes it hard to see which events or operators are pulling more weight, and which ones are lagging.
Second, supplier and subcontractor emissions are still grouped into broad categories. So while the top-line picture is there, the finer detail isn't. If you want a clean audit trail, that matters.
Third, F1 does not publicly disclose the fuel source, certification, or batch consistency for SAF and HVO100. That's a big deal for outside verification. If the label says lower-carbon fuel, independent reviewers still need the paper trail behind it.
Sea freight adds another layer. It's still under study, and sustainable marine fuels do not yet have cross-carrier availability.
| Data Category | Current Disclosure Level | Key Improvement Needed Before 2030 |
|---|---|---|
| Road Freight | High: 83%–89% reductions verified in Europe | Global rollout of HVO100 or electric fleets outside Europe |
| Air Freight | Moderate: 20% SAF usage for long-haul; 17% fleet efficiency gains | Scale SAF to 100% and reduce total air-freight volume |
| Sea Freight | Low: Not yet deployed at scale | Transition to sustainable marine fuels |
| Scope 3 / Suppliers | Low: General categories only | Standardized reporting across all teams and major suppliers |
| Per-Race Mode Split | Partial: SAF share and truck types disclosed | Event-by-event air/sea/road breakdown |
| Fuel Provenance | Qualitative only | Certified feedstock audits and batch consistency data |
Conclusion: Real Progress, but the Hardest Cuts Are Still Ahead
The operational fixes are real, but the audit trail is still too thin to confirm the full path to net zero.
F1 has made real progress through better routing, regional calendars, HVO100 trucking, SAF, and more remote operations. But the hardest part is still sitting in plain sight. Long-haul air freight remains the biggest problem. Sea freight is not ready to replace air freight across the full global calendar. And cost stays the main barrier, because decarbonizing logistics doesn't stop with F1 itself; the whole supply chain has to change too.
The gains are real. The proof that F1 is fully on track for 2030 is still missing.
FAQs
Is F1 on track for Net Zero 2030?
F1 is still committed to net zero by 2030. By the 2022 season, it had cut its carbon footprint by 13% compared with 2018.
The biggest pressure point is logistics, which account for 45% of annual emissions. That makes transport one of the clearest ways to judge whether progress is happening or not.
The main moves so far include:
- shifting freight from air to sea and rail
- regionalizing the calendar
- using HVO100 and SAF
- expanding remote operations
At the same time, a few stubborn problems are still on the table. The sport still needs standard lifecycle data, and there are still open questions around recycled-material performance.
Why is air freight still the biggest challenge?
Air freight is still Formula 1’s biggest logistics headache. The reason is simple: the calendar is packed, and teams have to move critical equipment fast and without slipups from one continent to the next.
Those tight shipping windows are driven by commercial and broadcast demands. And they often leave little room for slower, lower-carbon options like sea or rail. So even as teams fine-tune routes and use more sustainable aviation fuel, air transport remains the toughest part of the sport’s carbon footprint to cut.
What data is still missing from F1’s reporting?
F1’s reporting still misses some key logistics details.
The biggest gap is incomplete tracking of road transport before and after races. That includes trips between docks, airports, and circuits. And that helps explain why calculated logistics emissions come in below the higher totals F1 reports.
There’s also no complete count of the transport vehicles used by teams and by F1 itself. On top of that, regional logistics data varies across third-party carriers, especially on complex sea freight routes.