Ultimate Guide: F1 Weather Effects on Thermal Efficiency
How ambient conditions alter engines, ERS, brakes and tires—trade-offs between cooling, drag, and race strategy for optimal thermal performance.
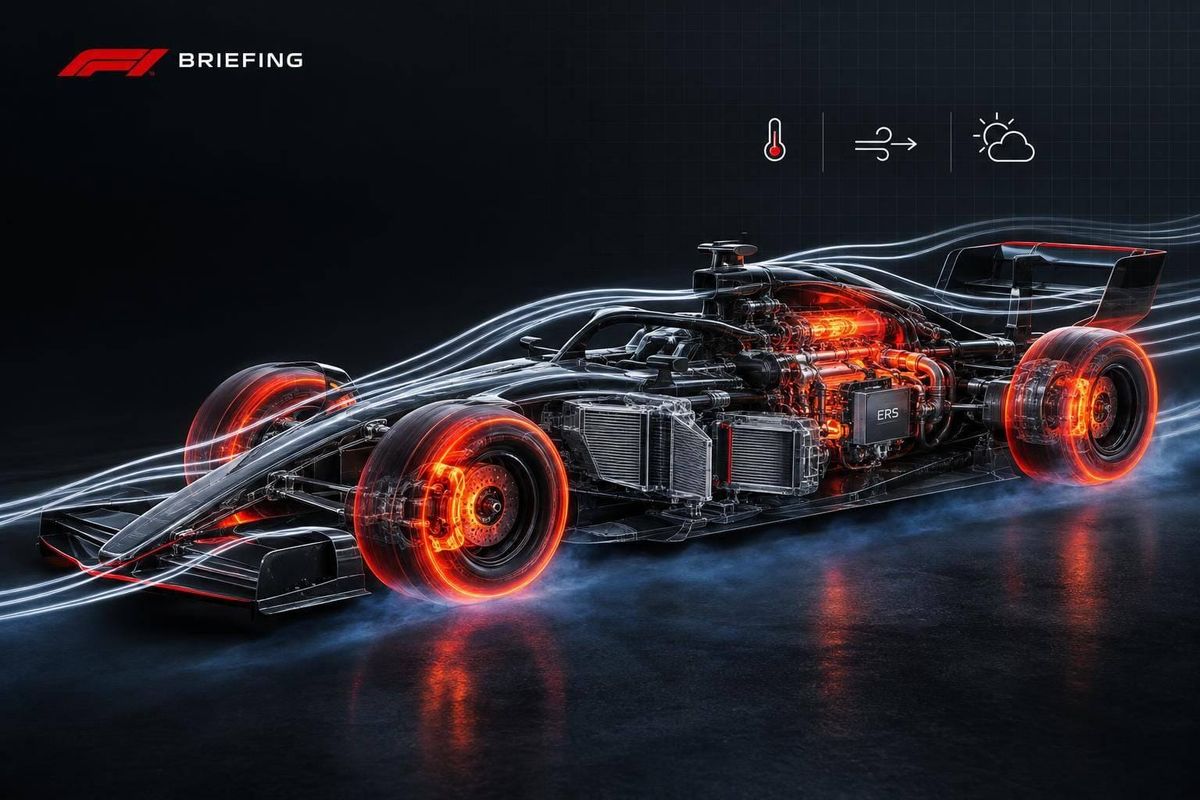
Hot weather can force an F1 car to cut power. Cold weather can cost grip. The goal is to keep the power unit, battery, brakes, and tires within their temperature limits - not simply make everything cooler.
At the 2019 Austrian Grand Prix, roughly 91°F (33°C) air temperatures helped force Mercedes to reduce power despite opening all available cooling ducts. But reduced output doesn’t automatically mean lower engine thermal efficiency: heat control and fuel-to-power conversion are different measures.
The main trade-offs are:
- Power unit and ERS: Heat can limit output, charging, and deployment. The 2026 removal of the MGU-H shifts electrical recovery toward the MGU-K.
- Brakes and tires: Cold, rain, and drying asphalt change warm-up, grip, and wear. Tire surface heat alone doesn’t reveal internal temperature.
- Cooling and airflow: Larger openings can shed more heat but add drag. Humidity, altitude, wind, and traffic also affect cooling.
- Race decisions: Teams must weigh forecasts, tire choice, energy use, and restart temperatures against lap time and reliability.
Weather alone cannot explain pace or efficiency. Component temperatures, tire condition, traffic, and energy use provide the context.
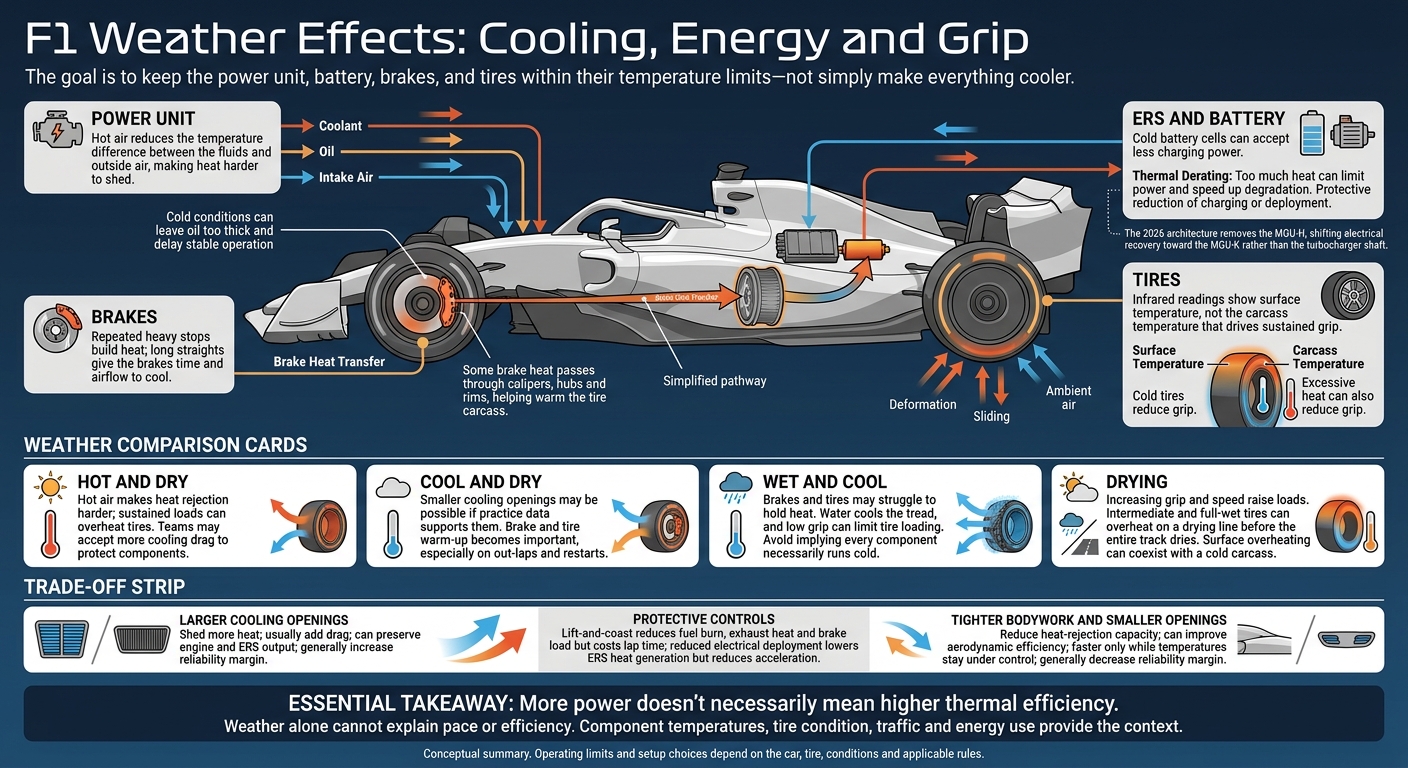
F1 Weather Effects: Cooling, Energy and Grip
Cooling F1 Cars - Why Mercedes suffer when following cars
sbb-itb-7c68254
Power Unit and ERS: Managing Heat and Energy
Fuel’s chemical energy becomes energy in combustion gases, then splits between crankshaft work and losses. Energy leaves through exhaust gases, coolant, oil, and other heat paths. Friction, pumping losses, and auxiliary loads also reduce useful work.
These paths overlap. Friction eventually becomes heat, so counting both as separate losses would count the same energy twice. Braking recovery, meanwhile, stores some of the vehicle’s kinetic energy for later use - it doesn’t create another supply of fuel energy.
Engine, Turbocharger, and Fluid Cooling
Radiators move heat from coolant into the outside air. Separate or partly integrated coolant circuits serve different components. Oil carries heat away from bearings, gears, pistons, and turbocharger parts while providing lubrication.
Charge-air cooling removes heat added as the turbocharger compresses intake air. This increases charge density and reduces the risk of knock or pre-ignition. Coolant, oil, and intake air each have their own temperature targets; there’s no single “engine temperature.”
Hot air reduces the temperature difference between the fluids and outside air, making heat harder to shed. Cold conditions bring another problem: too much cooling can leave oil too thick and delay stable operation.
Air density and humidity also affect how much oxygen is available for combustion, while turbocharging and engine controls shape the result. More power doesn’t necessarily mean higher thermal efficiency. Output can change without increasing the share of fuel energy converted into work.
2026 MGU-K and Battery Heat Limits
The 2026 architecture removes the MGU-H, shifting electrical recovery toward the MGU-K rather than the turbocharger shaft. Both harvesting and deployment generate heat in the motor-generator, inverter, cables, and battery.
Cold battery cells can accept less charging power. Too much heat can limit power and speed up degradation. Thermal derating deliberately cuts charging or deployment to protect components. The battery-management system tracks temperature, current, voltage, and cell balance. It can reduce power or shut down the ERS if conditions become unsafe. Exact cell-temperature limits vary by manufacturer; they aren’t universal public figures.
Cooling Choices and Performance Costs
Engineers track temperatures and how fast they’re rising, along with traffic, remaining distance, and expected weather. A protective power cut may be needed even when combustion efficiency hasn’t fundamentally changed. Cooling setup and energy management provide different ways to maintain a safe temperature margin:
| Choice | Cooling effect | Aerodynamic effect | Energy and lap-time cost | Reliability margin |
|---|---|---|---|---|
| Larger cooling openings | Shed more heat | Usually add drag; may make airflow less efficient | Can preserve engine and ERS output, but reduce speed | Generally increases |
| Tighter bodywork and smaller openings | Reduce heat-rejection capacity | Can improve aerodynamic efficiency | Faster only while temperatures stay under control | Generally decreases |
| Lift-and-coast | Reduces fuel burn, exhaust heat, and brake load | No direct bodywork change | Costs lap time and changes opportunities to recover braking energy | Can protect the power unit and brakes |
| ICE power-management changes | Reduce combustion heat and component stress | No direct bodywork change | Less mechanical power and ability to attack | Increases thermal headroom |
| Reduced electrical deployment | Generates less heat in the MGU-K, inverter, cables, and battery | No direct bodywork change | Less acceleration; preserves stored energy | Protects battery and ERS |
Brakes and Tires: Generating and Retaining Heat
After power-unit heat management, brakes and tires are the next thermal systems affected by weather.
Brakes and tires need the right operating window - not maximum heat. Friction heats the discs and pads. Some of that heat passes into the calipers, hubs, and rims, helping warm the tire carcass. Airflow and conduction carry heat away, while contact, deformation, and sliding control heat transfer with the track and heat buildup inside the tire. Infrared readings show surface temperature, not the carcass temperature that drives sustained grip. Too much heat can reduce tire grip or make braking less consistent.
Brake Cooling and Tire Warm-Up
Repeated heavy stops build heat; long straights give the brakes time and airflow to cool. Within event rules, teams adjust duct inlets, outlets, shielding, and drum geometry to control how much heat escapes and how much reaches the wheel.
Smaller brake ducts retain heat, but they also increase the risk of overheating the discs, pads, and tires. The balance: enough cooling for the hardest braking phase without giving up tire warm-up, aerodynamic efficiency, or consistent tire behavior elsewhere on the lap.
2023 Las Vegas Grand Prix: Pirelli selected C3, C4, and C5, the three softest compounds, with minimum starting pressures of 27 psi front and 24.5 psi rear; the engineering goal was to preserve tire heat on the long straights while limiting sliding and graining. Those details apply to 2023 hardware and rules, not 2026 equipment.
Slick, Intermediate, and Full-Wet Tire Temperatures
Rain, drying asphalt, and air temperature determine whether tires gain or lose heat. Each tire construction responds differently, so the operating window depends on both the compound and track conditions.
| Tire type | Heat generation | Cooling from water; limit is drying-track overheating | Main overheating risk | Setup focus |
|---|---|---|---|---|
| Slick | Deformation, cornering, braking, and sliding | Little water cooling on dry asphalt; track temperature and sliding dominate | Surface overheating, blistering, and pressure growth | Balance warm-up with camber, pressure, toe, brake bias, and cooling |
| Intermediate | Deformation and sliding; wet grip limits loading | Water cools tread; drying lines accelerate heating | Overheating and rapid wear as the track dries | Match tire choice and pressures to water depth and crossover timing |
| Full wet | Low grip and loads can hinder warm-up | Strong water cooling; standing water limits contact and visibility | Localized overheating from sliding or a drying line, even when the carcass stays cold | Limit wheelspin; manage cooling on wet patches and switch before excessive drying |
Blanket settings are not the tire’s running temperature. Reporting from Las Vegas described a 2023 preheating limit of 158°F (70°C) for up to two hours - not an on-track target. Blanket limits vary by tire type and event rules. Measured tread and sidewall temperatures are also separate from blanket-controller settings.
Cold Tires, Graining, and Overheating
As the track cools or dries unevenly, teams must balance warming the tire with protecting its tread.
Cold tires reduce grip. Graining happens when rubber tears under shear, while blistering is deeper heat damage caused by excessive internal temperature. Weather changes the balance between retained heat, tread damage, and usable grip. It isn't simply a matter of making tires hotter or colder.
The wet 2016 Brazilian Grand Prix at Interlagos shows the same problem: limited grip and water cooling can restrict carcass heating while wheelspin overheats the tread locally, although this does not establish measured tire temperatures. Smooth throttle, steering, and brake release reduce surface abuse. The race’s tire, blanket, car, and wet-weather rules differ from those of 2026.
Cooling Aerodynamics and Race-Weekend Setup
Cooling Openings, Drag, and Airflow
When temperatures climb beyond the safe range, teams face a trade-off: how much extra drag can they accept to keep the car cool?
Cooling drag is the aerodynamic cost of pushing air through the car. Pressure differences between sidepod inlets and outlets drive that airflow. Pressure losses through radiators and disturbed air at the exits add drag. Larger exits help remove heat, but they can disrupt airflow around the rear bodywork and reduce diffuser performance. Brake ducts also change wheel wakes.
Conditions add another layer. Crosswinds change inlet and outlet pressures, while traffic makes airflow less predictable. At altitude, lower air density reduces cooling-air mass flow. Repeated acceleration and short straights can leave little time for temperatures to recover.
Weather therefore changes more than temperatures. It changes the aerodynamic cost of keeping them under control - as Mercedes found when heat and altitude squeezed its cooling margin in Austria.
Mercedes, 2019 Austrian Grand Prix: At roughly 91°F (33°C) ambient temperature and 2,165 feet (660 meters) elevation, Mercedes opened all available cooling ducts but still had to run below maximum power. Drivers used up to 1,312 feet (400 meters) of lift-and-coast per lap. The W10’s tightly packaged cooling system left too little thermal margin for those conditions, and larger outlets also compromised rear-bodywork airflow. This remains a 2019 hardware example, not evidence about 2026 cars.
Setup Choices by Weather Condition
Teams don't simply choose a cooling setup for the race. They look for the least costly compromise for the forecast.
| Conditions | Power-unit cooling and ERS margin | Brake heat and tire warm-up | Cooling drag and reliability |
|---|---|---|---|
| Hot and dry | Open cooling more, reduce deployment risk, and watch temperatures closely. | Brakes receive heavy heat input; tires can overheat under sustained load. | Accept more cooling drag to protect components. |
| Cool and dry | Use smaller openings if practice data supports them; retain power-unit and ERS headroom. | Focus on brake and tire warm-up, especially on out-laps and restarts. | Smaller openings can cut drag, but too much airflow can hinder warm-up. |
| Wet and cool | Reduce cooling exposure where rules allow; focus on visibility, demisting, and steady temperatures. | Brakes and tires may struggle to hold heat. | Running too cold can threaten reliability, just as overheating can. |
| Hot and humid | Rely on measured component temperatures and air density, not humidity alone. | Brakes and tires may still struggle to shed heat, while drivers need more cooling. | Add margin only where the data supports it. |
| Drying | Prepare for higher loads as speeds and grip increase. | Intermediate or full-wet tires can overheat on a drying groove before the whole track dries. | Base cooling and tire calls on the fastest usable line. |
Each choice needs car-specific data. Practice results, traffic, and interruptions can then change the cooling load the car actually faces.
Forecasts, Driver Inputs, and Race Interruptions
Start with the forecast, then account for the circuit: full-throttle time, braking severity, altitude, and likely traffic. In practice, compare radiator pressure drop, component temperatures, ERS state of charge, and deployment in clean air versus traffic. Choose the smallest cooling package that protects race margins, then check which bodywork and cooling changes the event’s parc fermé rules permit.
Safety-car periods create competing effects. Brakes and tires can lose useful heat, while reduced radiator airflow limits power-unit heat rejection. Engine load also drops, so teams need to monitor temperatures rather than assume they'll fall.
After a red flag, airflow stops and stored heat can spread into nearby components - a process called heat soak. Teams must monitor power-unit and ERS temperatures, use only permitted cooling and warming procedures, and prepare brake and tire temperatures for the restart under the applicable FIA instructions.
Conclusion: Balancing Temperature, Energy, and Grip
Weather changes the car’s entire thermal balance, not just one system. The fastest setup keeps every system within its operating window while balancing cooling drag, energy, and reliability.
Diagnosis matters as much as setup. Teams need to separate what the weather changed from the performance the car actually lost.
Thermal Performance Checklist
Check the power unit, ERS, brakes, and tires - in that order. For each, assess temperature margin first, then performance loss, then reliability risk.
- Temperature margin: Check whether thermal protection reduces usable deployment or charging headroom. Supplier limits don’t reveal a team’s internal safety margin.
- Grip margin: Check brake consistency and assess tire surface and carcass temperatures separately. Track pressure, balance, graining, and degradation as separate factors.
- Reliability margin: Weigh cooling drag against losses from temperature management. Watch for repeated hot laps that add component stress or trigger protective settings.
Public results show correlations, not internal thermal states. Use a lap-time chart that includes weather in °F and °C, tire compound and age, traffic, pit stops, safety cars, and major session changes. Label these details by source, and mark fuel-load adjustments as estimates.
FAQs
How can fans spot heat-related power loss?
Watch for slower sector deltas. They may suggest teams are changing engine modes to prevent overheating. Opening the cooling louvers further can also add drag and cut straight-line speed.
Team radio can offer clues, too. Comments about the car feeling sluggish or the need to lift and coast may suggest the power unit’s output is being limited to protect components from heat damage.
Can better cooling offset its added drag?
Yes. Added cooling usually increases aerodynamic drag. But in hot conditions, it can help maintain power unit thermal efficiency and tire performance.
Too little cooling can cause the engine to overheat or tires to degrade early. Drivers may then need to lift and coast or use reduced-power modes - both of which can cost more lap time than the extra drag.
Teams have to balance cooling against drag: too much drag can cancel out the gains from cooling and hurt overall race pace.
Why can cold tires overheat on the surface?
When tires are too cold, the rubber stiffens and loses grip, making the car slide as the driver searches for traction. That sliding creates friction, which quickly heats the tire’s surface while its internal carcass stays relatively cool. The heat stays concentrated at the surface, damaging the rubber and reducing peak performance. Teams must carefully balance track roughness, ambient temperatures, and aggressive driving inputs to control tire temperatures.