5 Models for Predicting F1 Team Outcomes
Compare five forecasting approaches—Elo, regression, time-series, Monte Carlo, and scorecards—to predict F1 team pace, points, and title odds.
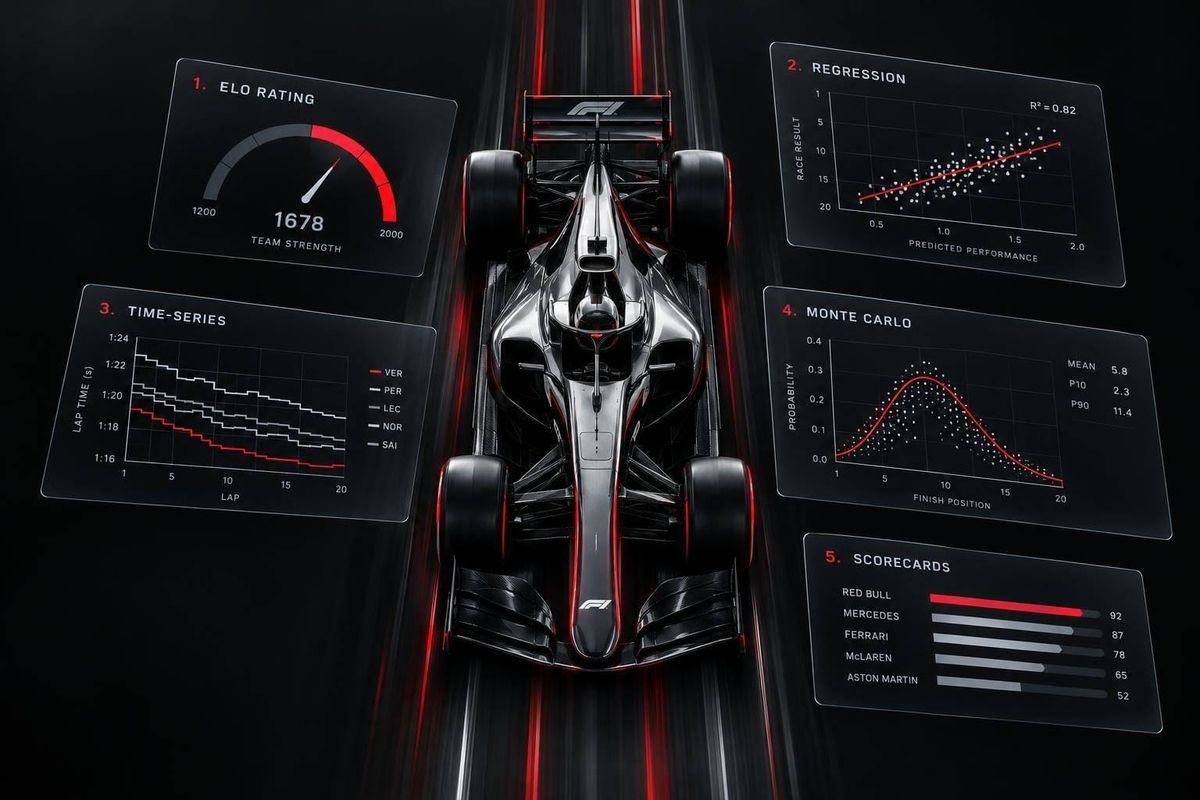
Predicting F1 team outcomes starts with choosing a target: points, finishing order, or title chances. These five models answer different questions - and can work together:
- Dynamic Elo: Updates team strength after each session.
- Regression: Estimates pace, points, or event probabilities from inputs such as grid position and reliability.
- Time-series forecasting: Tracks changes in form across races.
- Monte Carlo simulation: Runs thousands of virtual races to estimate race and championship probabilities.
- Weighted scorecards: Combine performance measures into an easy-to-explain ranking.
Quick Comparison
| Model | Best used for | Main limit |
|---|---|---|
| Dynamic Elo | Short-term strength and head-to-head comparisons | Does not fully model race events |
| Regression | Connecting race inputs to predicted results | Missing inputs can skew forecasts |
| Time-series forecasting | Tracking form and development | Rule changes can disrupt trends |
| Monte Carlo simulation | Race outcomes and title chances | Depends on the quality of its inputs |
| Weighted scorecards | Rankings when data is limited | Scores are not probabilities |
The test is whether a model predicts later races - not whether it fits past results. Use only data available at the forecast cutoff, account for shared risks between both cars, and compare results with a simple baseline. Report uncertainty, too: across many forecasts, a calibrated 20% retirement probability should correspond to retirements about 20% of the time.
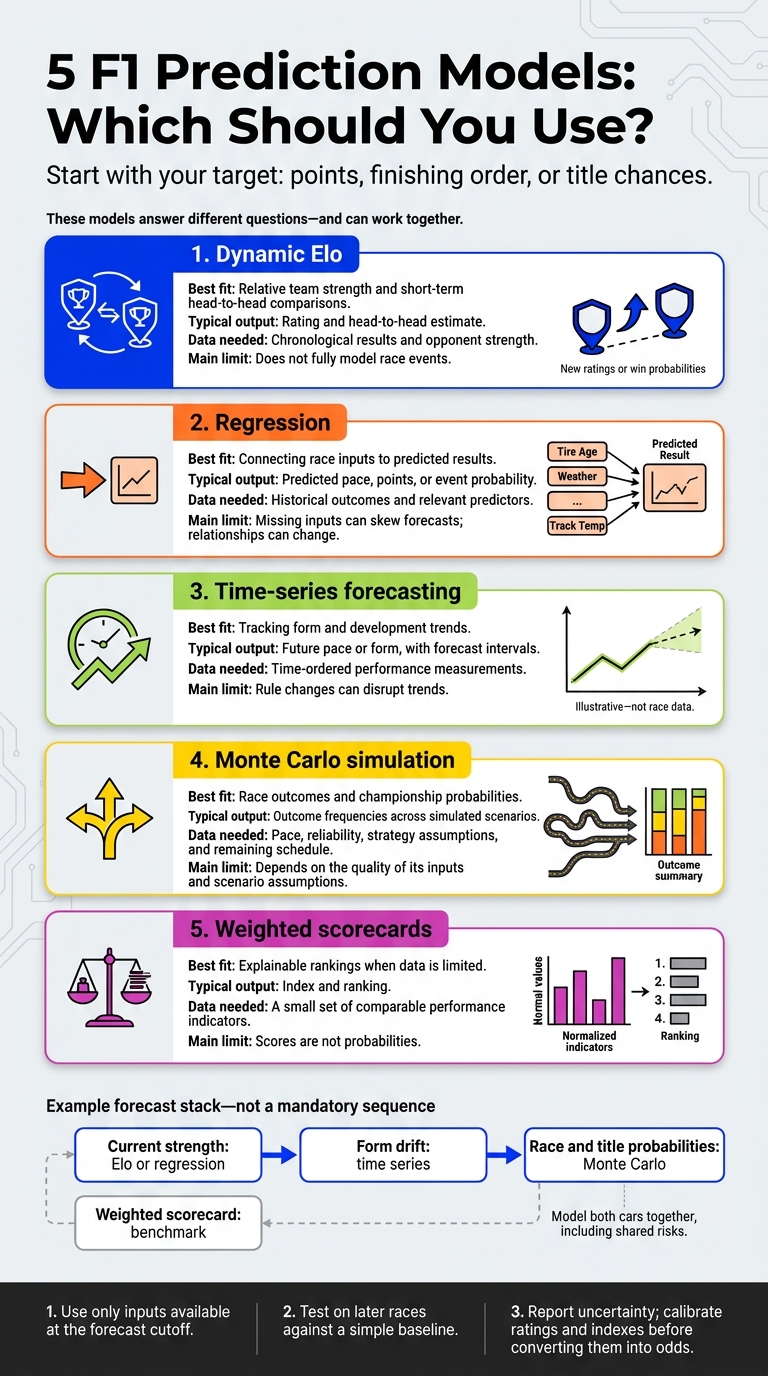
5 F1 Prediction Models: Which Should You Use?
Set the Forecast Target and Data Cutoff
Define exactly what you’re forecasting: a driver’s result, team points, podium probability, retirement risk, or title chance. Qualifying position calls for a driver-level result, while a team forecast must explain how it combines both cars’ results. Keep underlying form separate from finishing position and points. A constructors’ title forecast needs a season-level probability - not just a pace ranking. The target determines which model fits best.
Record when each input became available, not when the event happened. A pre-qualifying forecast can’t use the eventual grid, penalties announced after the cutoff, or later weather updates. During a race, use only the laps and conditions known at that moment. Otherwise, future data leaks into the forecast and makes test results look better than they are.
Treat the two cars as correlated, not independent: one shared system with two outputs. Include shared team-level factors alongside car-specific inputs for drivers, setups, incidents, and pit stops. For points forecasts, add both cars’ expected totals. For podiums or retirements, model the dependence between the cars rather than adding their probabilities.
Separate pace from race execution when the target calls for it. Estimate performance potential first, then account for tire degradation, traffic, pit windows, and reliability. That way, a strategy loss doesn’t get mistaken for a slow car, and a mechanical retirement doesn’t count as evidence of poor pace. Different models handle pace and execution differently, so this split affects model choice.
Use that season’s official points table, including Sprint scoring. Keep Sprint and Grand Prix results separate before combining weekend totals.
sbb-itb-7c68254
1. Dynamic Elo Ratings
Dynamic Elo tracks changes in team strength from session to session as tire compounds, weather, and upgrades change. It works best for near-term team strength, rather than a full-season simulation.
Required Data
Use session results, driver and constructor identities, teammate gaps, retirement causes, and circuit conditions. Keep qualifying and race ratings separate.
Teammate comparisons help reduce equipment bias, but strategy, reliability, and team orders still affect results. When the data allow it, estimate separate car and driver ratings instead of attributing every result to the driver.
Elo compares actual performance with expectations: rating change = K × (actual score − expected score). A 100-point gap points to a stronger head-to-head expectation - not a 64% chance of winning the race. Calibrate the scale using F1 data.
Forecasts and Best Uses
Elo suits frequent updates. Start with rankings, then test how well they work as a forecasting baseline.
| Inputs | Output | Best use | Main weakness |
|---|---|---|---|
| Qualifying head-to-head results, normalized lap-time gaps, and teammate gaps | Qualifying ratings and matchup probabilities | Short-term pace comparisons | Unequal equipment and session disruption |
| Race finishes, points, and retirement causes | Race ratings and expected order | Quick race-form updates | Strategy and reliability distort results |
| Driver-car ratings and track adjustments | Context-adjusted matchups; points and podium forecasts with additional modeling | Team comparisons | Limited data for separating car, driver, and track effects |
Form Changes and Uncertainty
Ratings can change after every session. A larger K-factor responds faster; a smaller one softens the effect of noisy results.
When a driver transfers, carry their rating forward, pair it with the new car rating, and allow more uncertainty. After major rule changes, reduce part of the previous rating advantage rather than carrying it over unchanged.
Strengths and Limits
Give unrelated mechanical retirements little or no pace penalty, and test a separate approach for driver-caused incidents. Add track or weather adjustments, and cap each update when a single race produces many correlated pairwise comparisons.
Elo is fast and transparent, but it doesn't fully model race strategy or season-long title odds. To model how several inputs affect points or finishing position, move to regression.
2. Regression Models
Elo tracks strength. Regression estimates how inputs relate to points, pace, and finishing position.
Required Data
For pre-qualifying forecasts, use prior results, practice pace, form, circuit traits, reliability, tire compound, and the weather forecast. After qualifying, add grid position and qualifying gap.
Useful variables include the qualifying time gap to pole, fuel-corrected long-run pace, tire compound and degradation, expected pit-stop count, circuit type, driver, team, track temperature, precipitation probability, wind, and historical retirement rates.
Adjust practice times for fuel load, grip, traffic, and track evolution. If fuel-corrected long-run pace isn't available, clearly label the estimate. Use only information available at the forecast time. Final race position, laps completed, actual pit stops, and realized race weather cannot be used to predict an earlier event.
Forecasts and Best Uses
| Model | Target | Interpretability | Data needs |
|---|---|---|---|
| Linear | Qualifying gap, stint pace, expected points | High; coefficients show conditional changes | Clean continuous targets and pace/context inputs |
| Regularized models (ridge, lasso, elastic net) | Pace or points with many overlapping predictors | Moderate to high; penalties stabilize coefficients | Standardized inputs and time-aware cross-validation to choose the penalty |
| Logistic | Q3, podium, points finish, or DNF probability | High; coefficients translate into odds ratios | Binary outcomes and probability-calibration checks |
| Ordinal or rank-ordered | Finishing order or ordered position bands | Moderate; respects ordering without assuming equal gaps between positions | Ordered labels and enough observations across positions; check proportional-odds assumptions |
Build separate models for qualifying, race pace, retirements, and points. A points model can combine grid position, predicted pace, expected pit stops, weather, and DNF risk. For team forecasts, add both drivers’ regression-predicted expected points and model uncertainty around that total.
Form Changes and Uncertainty
Calculate form using the previous three or five events, never later results. Update team-season effects over time. Validate with expanding windows, keeping each race intact.
Report prediction intervals for pace and points, plus calibrated retirement probabilities. A calibrated 20% DNF forecast should correspond to retirements about 20% of the time across similar cases.
Strengths and Limits
Regression is transparent and quick to retrain. But missing fuel data, correlated inputs, and changes in car performance can weaken its forecasts. Keep both grid position and qualifying gap only if each improves forecasts for later races.
Test a small set of nonlinear terms and interactions, such as tire compound × track temperature, grid position × overtaking difficulty, and team × circuit type. Keep them only if they improve out-of-sample results.
Coefficients show associations, not causation. A grid-position effect may partly reflect car speed and driver quality. Extra pit stops may reflect damage rather than cause a poor finish.
Compare the model against a starting-grid or average-pace baseline. Judge it by pace error and probability scores, not historical fit alone. For gradual form shifts, time-series models handle the trend better.
3. Time-Series Forecasting
When team form changes gradually, time-series methods track the trend better than one-shot regressions.
Required Data
Build race-by-race sequences for team points, qualifying gap, adjusted qualifying and race pace, tire degradation, and reliability. Keep qualifying and race pace separate: one-lap speed and race trim often tell different stories.
Record weather, circuit type, and the first race where an upgrade appeared. This helps separate car development from changes caused by the calendar.
Forecasts and Best Uses
Use these methods to forecast changing team form, rather than a single-event result. Work with race-level sequences for team form and lap-level sequences for tire behavior. Compare the options below before adding complexity.
| Method | Inputs | Best use | Main limits |
|---|---|---|---|
| Historical baseline | Prior-season results, same-circuit history, or long-run team average | Reference forecasts for points or pace under stable regulations | Misses current upgrades, driver changes, and regime shifts |
| Rolling average | Points, pace, or reliability from the latest 3 or 5 events | Short-term form with a calculation that's easy to follow | Depends on the chosen window and can lag sudden changes |
| Exponential smoothing | Sequential points, pace, or reliability metric with a chosen decay parameter | Giving recent races more weight without discarding history | Needs tuning and may overreact to one unusual race |
| State-space model | Hidden team strength plus observed pace, points, reliability, and context variables | Gradual performance development and explicit uncertainty | Harder to specify, fit, and explain |
| ARIMA-style model | A long, regular series of one metric, with outside factors added when useful | Recurring patterns and trends in team pace or points | Small F1 samples, irregular calendars, rule changes, and shifting performance patterns can weaken results |
Form Changes and Uncertainty
Mark upgrades from their first actual use, noting whether one or both cars received them. Allow for an immediate effect or a gradual gain as the team improves its setup. Major FIA regulation changes may require resetting the series, splitting it, or giving older data less weight.
Report the latest race and upgrade included, the sample size, and a point forecast with a 90% prediction interval.
Strengths and Limits
Calendar order can make development trends misleading. A run of favorable tracks, for example, may look like lasting improvement. Include calendar position, Sprint format, and overlapping circuit features instead of giving each track just one label.
Share information across teams, drivers, or similar circuits, but keep separate adjustments for each. This helps prevent small samples from producing false trends.
Test next-race forecasts with rolling-origin backtesting: move the training cutoff forward one event at a time. Compare mean absolute error for pace or points, plus prediction interval coverage, against the simple baselines. Feed predicted pace into race simulation when safety cars, strategy, and retirements shape the result.
4. Monte Carlo Race and Championship Simulation
Required Data
Monte Carlo simulation turns forecasts into probabilities by running thousands of virtual races. Use it after estimating pace, reliability, and strategy inputs. Supply pace estimates, grid information, tire behavior, pit stop times, overtaking chances, incident rates, weather, and reliability.
| Input type | What belongs here | How to use it |
|---|---|---|
| Deterministic | Known grid, race distance, official season-specific scoring | Keep fixed unless an explicit scenario changes it |
| Probabilistic | Pace, unknown grid positions, tire degradation, pit stop duration, overtaking, failures | Sample plausible values or outcomes in each trial |
| Scenario-based | Rain, safety cars, red flags | Model event timing and effects; assign supported probabilities or report scenarios separately |
Forecasts and Best Uses
Use simulation to compare pit strategies and estimate championship chances. For team forecasts, simulate both cars together and add their points to the constructors’ standings. Score every trial using that season’s FIA points system. For title forecasts, start with current points and simulate every remaining event.
Define outcomes before running the model: a win means P1, a podium means a top-three finish, and retirement means DNF, tracked separately from classified finish. Report median points, 5th–95th percentile ranges, and driver or constructors’ title probabilities.
If you have limited input data, start with a weighted scorecard as your baseline before moving to full simulation.
Form Changes and Uncertainty
Sample shared team and car effects once per trial, then apply them to both entries. Likewise, draw weather and safety-car events once per race - not separately for each car. Let the effects differ by position and strategy.
Strengths and Limits
Simulation models risks that interact, but more trials won’t fix poorly calibrated inputs. Pace or reliability distributions that are too narrow make upsets less likely than they should be.
Report the trial count, then rerun independent batches until key probabilities settle within your chosen tolerance. Check whether the central 90% interval contains about 90% of outcomes.
5. Weighted Performance Scorecards
This model works when inputs vary, the sample is small, and you need a clear ranking before moving to more complex forecasts.
Required Data
Use scorecards to build a transparent pre-race baseline from mixed signals - not a fully probabilistic forecast.
Combine lap-level timing, pit-stop records, reliability history, strategy decisions, development trends, driver comparisons, and circuit characteristics into one comparable index. Put every input on a common scale before weighting it. Set the normalization rules and weights before reviewing results.
The table below shows where performance signals can overlap, helping you avoid counting the same strength twice.
| Metric | Role | Normalization to 0–100 | Double-counting risk |
|---|---|---|---|
| Qualifying pace | One-lap speed | Percentile or z-score versus the field | Sector speed and qualifying gap |
| Race pace | Sustained speed | Median gap per lap, adjusted for traffic and fuel | Long-run pace |
| Tire management | Stint durability | Compound- and circuit-adjusted degradation percentile | Race pace and stint length |
| Pit stops | Pit-stop execution | Time lost versus the field median, converted to 0–100 | Race position or strategy outcome |
| Reliability | Completion potential | Reliability rate or expected laps completed | Classified-finish rate or points |
| Strategy | Decision quality | Expected-versus-realized gain, scenario-adjusted | Tire choice and pit timing |
| Development | Technical progress | Pre/post-upgrade adjusted pace change | Recent-form pace |
| Drivers | Driver contribution | Teammate-adjusted pace and error rate | Team pace or total race result |
| Circuit suitability | Track-car fit | Predefined circuit-type adjustment | Historical track results |
Forecasts and Best Uses
Calculate the index as the weighted sum of normalized scores, with weights totaling 100%. Use it for pre-race team rankings you can explain and quick constructors comparisons - not automatic win probabilities. A score of 82 does not mean an 82% chance of winning.
Check correlations and cap related metric groups so one strength doesn't earn points twice.
| Forecast setting | Pace* | Tires | Reliability | Driver contribution | Execution and strategy | Development | Circuit fit |
|---|---|---|---|---|---|---|---|
| Baseline race | 40% | 15% | 10% | 10% | 15% | 5% | 5% |
| Tire-limited circuit | 30% | 30% | 10% | 10% | 10% | 5% | 5% |
| Reliability-focused championship | 35% | 10% | 20% | 10% | 10% | 5% | 5% |
Pace = qualifying pace + race pace; execution combines pit stops and strategy.
Form Changes and Uncertainty
Blend recent form with long-term baseline performance using a fixed rolling or exponentially weighted window. Measure development through adjusted pace gains, not upgrade counts.
Define circuit adjustments in advance based on tire stress, downforce demand, straight-line sensitivity, braking severity, and street-circuit characteristics.
Keep controllable execution separate from external events. Lucky safety-car timing or an opponent’s collision shouldn't count as lasting team strength.
Strengths and Limits
The main strength is transparency. The weaknesses are subjective weights, overlapping inputs, and sensitivity to normalization.
Publish rank changes across sensitivity settings and flag rankings that shift easily. Backtest in chronological order using only pre-race information, then compare ranking error against standings, recent form, or the prior race’s ranking. Keep a held-out period for evaluation and calibrate probabilities separately.
Use the scorecard as a baseline before choosing or combining models.
Choose the Model for Your Forecast
Choose the model based on what you want to forecast - not how much data you have. The target and data cutoff guide your choice; the output determines how you test it.
Use this table to match each model to your forecast.
| Model | Best fit | Typical output | Data needed | Main limit |
|---|---|---|---|---|
| Dynamic Elo | Relative team strength | Rating and head-to-head estimate | Chronological results and opponent strength | Static ratings can miss how variables interact |
| Regression | Input-output relationships | Predicted pace, points, or event probability | Historical outcomes and relevant predictors | Relationships can change, and missing factors can skew estimates |
| Time-series forecasting | Development trends | Future pace or form, with forecast intervals | Time-ordered performance measurements | Major rule changes or upgrades can disrupt established trends |
| Monte Carlo simulation | Race and championship probabilities | Outcome frequencies across simulated scenarios | Pace, reliability, strategy assumptions, and remaining schedule | Results depend on the quality of the inputs and scenario assumptions |
| Weighted scores | Rankings with limited data | Explainable index and ranking | A small set of comparable performance indicators | Weights alone do not establish probability |
Use regression to explain how inputs relate to outcomes, time series to track form, and simulation to turn those inputs into probabilities. Race conditions change lap by lap, so fixed assumptions can miss shifts in the competitive order.
Calibrate outputs before converting them into odds if the model does not produce probabilities directly. Elo ratings and scorecard indexes need separate calibration before you convert them into win, podium, or title probabilities.
Combine and Test the Models
After choosing a model, test it within a forecast stack - not on its own. Use a layered workflow: Elo or regression for current strength, time series for form drift, Monte Carlo for probabilities, and the scorecard as a benchmark. Include correlated risks, such as weather, safety-car effects, and reliability, in the simulation. Train combination weights only on historical data to prevent leakage.
Set a fixed historical cutoff, then test the full stack with rolling-origin backtests. Train through Round 5, predict Round 6, move the cutoff forward, and repeat. Compare the combined forecast with each component and a no-change baseline that carries the latest strength estimate forward. Remove one component at a time to check whether it helps. Keep the combination only if its gains hold across different test windows - not just one favorable season.
Match the metric to the forecast output. Use mean absolute error for points or lap-time gaps, ranking correlation or top-k accuracy for team order, and log loss for event probabilities. Check calibration, too: an event assigned a 20% probability should happen about 20% of the time. For numerical forecasts, check whether an 80% prediction interval contains roughly 80% of outcomes, and report its width. Break down results by season, circuit type, and forecast horizon.
Save a dated input snapshot for every forecast. Use official classifications, qualifying results, points, lap and sector times, session status, and applicable sporting or technical regulations. Include only information available before the cutoff. Exclude later penalties, race data, and post-cutoff technical details. Record missing values, revisions, how you handle DNS/DNF results, driver substitutions, and regulation changes. If access is restricted, simplify the model and disclose the gap rather than inventing inputs. Verify licensing before automating collection.
Before publication, show component forecasts, combination weights, baseline results, error metrics, calibration plots, and uncertainty ranges. Document failure cases alongside improvements. Use F1 Briefing for qualitative context on strategy, upgrades, and team dynamics, but treat that context as a timestamped hypothesis - not a quantitative input.
Conclusion: Start With a Target and Baseline
Choose your target first. Points, finishing order, and title odds each call for different models and data cutoffs. Start with a recent-results baseline or Elo.
Then match the model to your question: use Elo for near-term strength, regression for relationships, time series for changes in form, simulation for probabilities, and scorecards for transparent rankings.
Add complexity only when out-of-sample testing shows repeatable gains, and report uncertainty ranges. Aim for an auditable forecast readers can update - not a guarantee.
FAQs
How much historical data do I need to start?
You don’t need a set number of years of data to start predicting F1 outcomes. You need a solid baseline for the circuit: tire degradation rates, pit-stop deltas, and each team’s past pace at that track.
Strategists usually start gathering these inputs about a week before a race. As models take in more data throughout the season, their predictions become more accurate.
How can I model a new team's performance?
Use historical data to set a baseline. Then bring car telemetry, driver performance, and pit crew efficiency into one dashboard. Use digital twins to test car performance and Monte Carlo simulations to model race scenarios, factoring in weather, fuel consumption, and competitor behavior.
As the season progresses, refine machine learning models with historical data and real-time telemetry. These updates help improve forecasts and guide car setup and race-day decisions.
What should I do when models disagree?
When predictive models disagree, teams should use human judgment to weigh predictions against conditions on the track. Models can't account for every detail. Experienced strategists may override a recommendation based on a driver's confidence after an incident, live traffic conditions, or how much track position matters at a specific circuit.
Clear rules for when people should step in help teams balance model predictions with expert intuition and awareness of what's happening on the track.