F1 TV Pit Wall Data: What Fans Get
Breaks down F1 TV pit-wall feed: live timing, sector trends, tire stints, driver tracker and five fan telemetry channels.
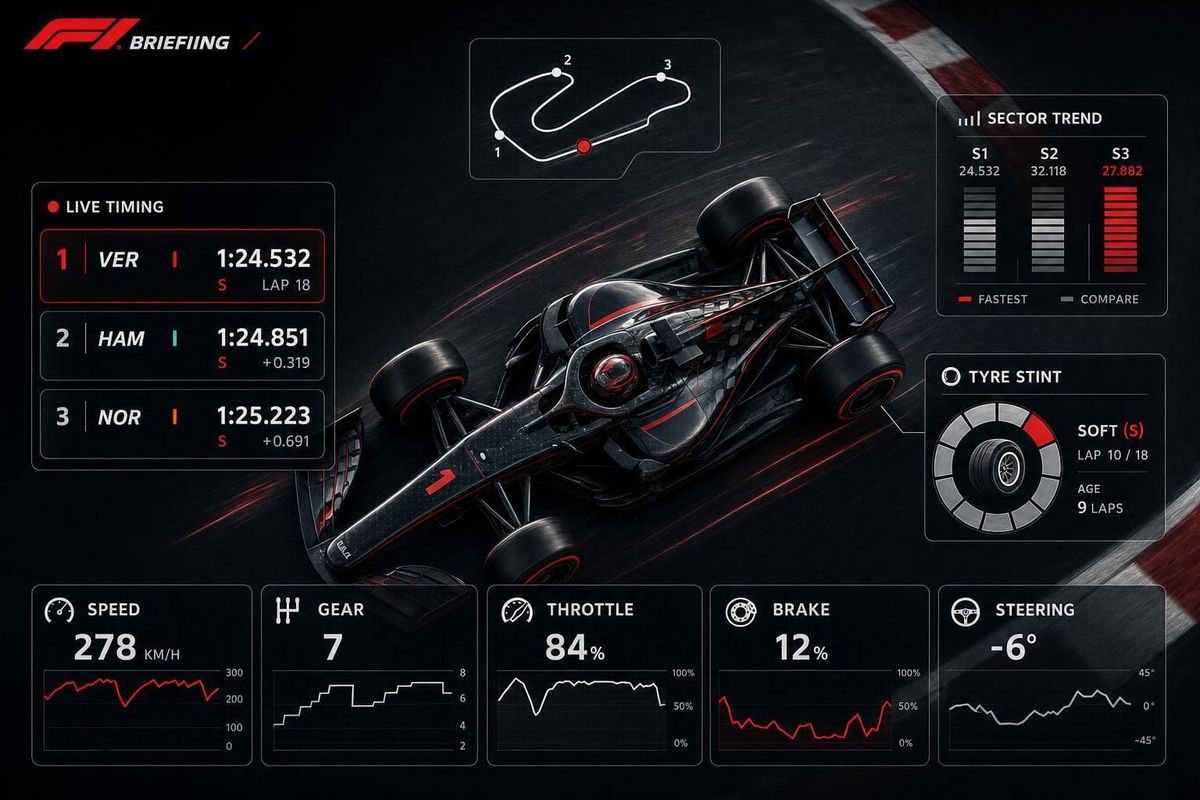
F1 TV gives me a strong race-reading view, but not the same data teams use on the pit wall. I can track gaps, intervals, sector times, tire age, pit stops, a live car map, and 5 fan telemetry channels: speed, throttle, brake, gear, and DRS.
Here’s the short version:
- I can use live timing to spot position changes, gap swings, and pit-stop outcomes
- I can use the data channel to read pace trends lap by lap
- I can check tire compound and stint age to judge undercuts, overcuts, and tire drop-off
- I can use the driver tracker to see traffic, DRS trains, and pit rejoin spots
- I can view basic telemetry, but I can’t see team-only data like tire temps, brake temps, ERS maps, fuel models, or team software
One number on its own means little. The best way I read F1 TV data is by linking intervals, sector splits, stint age, and track position on the same lap.
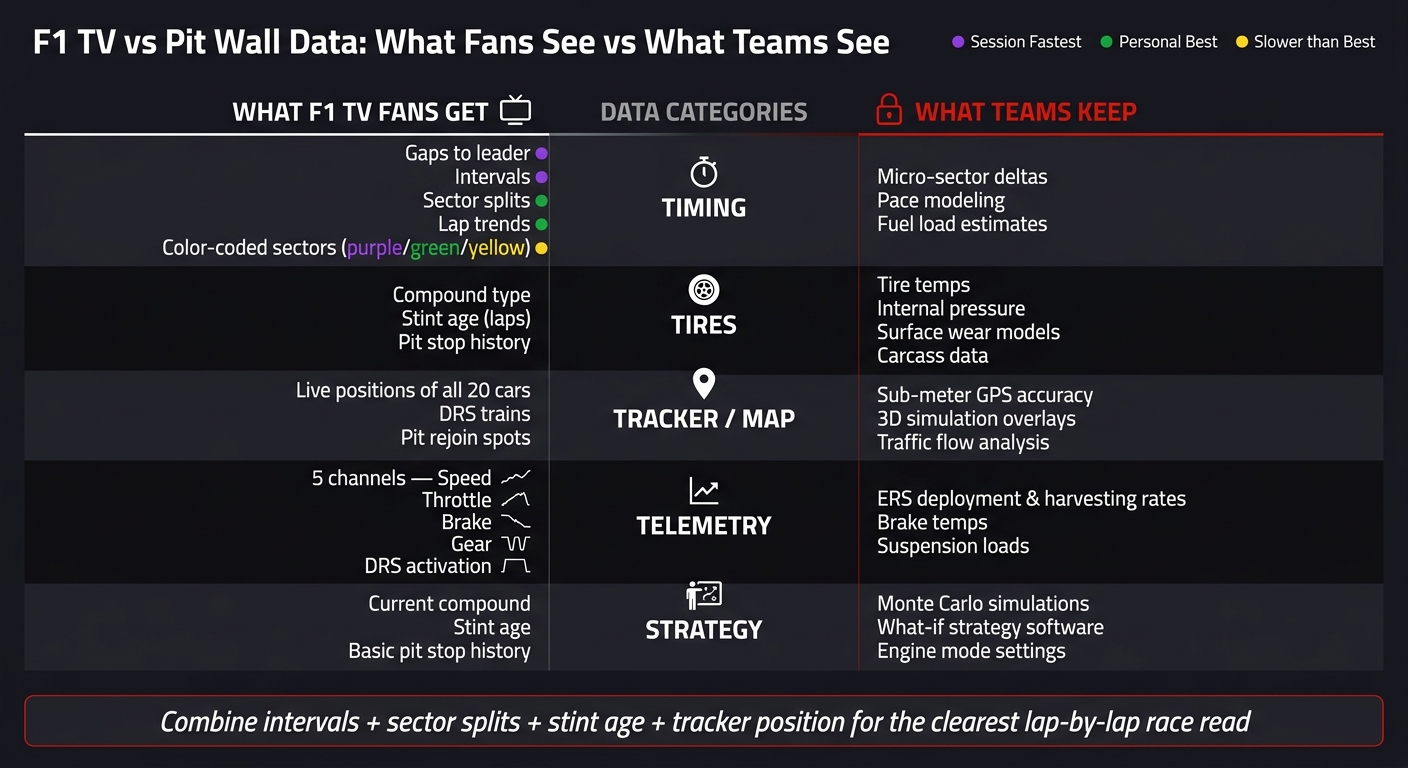
F1 TV vs Pit Wall Data: What Fans See vs What Teams See
The F1 Pit Wall Explained | Globant
sbb-itb-7c68254
Quick Comparison
| Area | What I Get on F1 TV | What I Don’t Get |
|---|---|---|
| Timing | Running order, gaps, intervals, sector splits, lap trends | Team pace models, deep delta tools |
| Tires | Compound, stint age, stop history | Tire temps, pressure detail, wear models |
| Tracker | Live car positions, traffic view, pit rejoins | Team-grade GPS detail, sim overlays |
| Telemetry | Speed, throttle, brake, gear, DRS | ERS use rates, brake temps, suspension loads |
| Strategy | Basic stop picture and tire offsets | Team strategy software and what-if tools |
Bottom line: F1 TV gives me enough data to follow the race with far more context than the main broadcast. It does not give me the team engineering layer. That line matters, and once I know it, the feed makes a lot more sense.
Live Timing and the Data Channel
Live timing shows what changed. The data channel shows how and why. That’s when the virtual pit wall starts to matter, because it turns raw numbers into race context. A simple way to use both: spot the change on live timing, then check the data channel to figure out what caused it.
What the Live Timing Screen Shows
Live timing shows the running order, gaps, intervals, tire compound, stint length, pit stops, and live sector splits.
What the Data Channel Adds
The data channel turns those quick snapshots into patterns. You can see sector times drift as tires wear, watch gaps change lap by lap, and follow telemetry for speed, throttle, brake, gears, and DRS. That matters because a driver stuck in a DRS train is dealing with a very different race than a driver in clear air, and the telemetry makes that easy to spot.
| Timing Component | What It Shows | What Fans Can Infer |
|---|---|---|
| Running order | The current position of every driver. | Overall race progress and which drivers are gaining or losing ground. |
| Gap to Leader | The total time difference between a driver and the car in P1. | How far ahead the leader is, or how much time a chasing driver still has to claw back. |
| Interval | The time difference between a driver and the car immediately in front. | Whether a driver is within the 1-second DRS window or under pressure from an overtake threat. |
| Sector Splits | Time taken to complete Sector 1, 2, and 3. | Where a car is strongest, like high-speed sections or tighter, more technical corners. |
| Tire Compound & Age | The current tire set and how many laps it has run. | Whether a driver is nearing the tire cliff or getting close to a pit window. |
| Pit Stop Data | Number of stops made and the duration of the pit visit. | Strategy changes and whether an undercut or overcut is working. |
| Telemetry | Real-time speed, gear, and DRS status. | Whether a driver is lifting and coasting or using maximum deployment to defend. |
How to Read a Race Lap by Lap
The best habit here is to watch intervals and sector splits together. If a driver is closing on the car ahead but the sector times look mostly steady, that gain may be coming from strategy, track position, or tire age instead of raw pace. On the other hand, if a driver is strong in one sector and weak in the other two, the timing screen shows exactly where that car has an edge and where it can get exposed.
Pit stop markers are another big clue. When a driver pits, then rejoins behind another car, the new interval tells you right away if that stop won or lost track position. Add tire age to the picture, and you can start judging whether the team stopped at the right moment or left the driver out too long on a set that was dropping away.
The picture gets sharper when you compare gap to leader, interval to the car ahead, and tire age on the same lap. That’s where the numbers stop looking like a spreadsheet and start telling the story of the race.
Gaps, Intervals, Lap Times, and Sector Splits
The timing tower throws a lot at you at once. But once you know how to read it, it stops looking like a wall of numbers and starts reading like a live map of the race.
The trick is simple: don’t look at one number on its own. The useful stuff happens when you read the metrics together.
Gap to Leader vs. Interval to the Car Ahead
What matters most isn’t the textbook meaning of each number. It’s how they work together on the same lap.
Interval tells you about the fight right in front of a driver. It shows how close they are to the car ahead. When that number drops below 1.0 second at the detection point, the chasing driver is usually close enough to get DRS at the detection point.
Gap to leader tells a different story. This is the number that helps you judge the bigger picture. It shows whether a driver has enough space to pit and come back out without losing track position to the cars behind. A pit stop usually costs about 20 seconds in lost track time, so a driver needs about that much margin to stop and still rejoin ahead.
Put those two numbers side by side on the same lap, and the pit window starts to show itself in plain sight.
What Lap Times and Sector Splits Actually Tell You
Sector deltas show where a driver is finding time or giving it away. That’s where the timing feed gets fun, because you can often spot the story before the commentators say it.
The colors matter:
- Purple means the fastest sector or lap set by any driver in that session
- Green means that driver’s own best sector or lap
- Yellow means slower than that driver’s previous best
That yellow time can mean a few things. Maybe the tires are fading. Maybe the driver hit traffic. Maybe they’re backing off on purpose to look after the car.
Here’s a good example: if a driver’s S3 times start going yellow while S1 and S2 stay green, that often points to the rear tires fading or overheating before the fronts. That kind of pattern tells you more than a single lap time ever could.
How Timing Trends Point to Strategy Changes
Timing trends can hint at strategy shifts before the pit lane makes it obvious.
A sudden lap-time gain or a shrinking interval can mean a few different things: the driver has moved into DRS range, found clean air, or started pushing for an undercut or overcut. Context matters.
If a driver’s sector times get better right after the car ahead pits, that doesn’t always mean they suddenly found extra speed. It can just be the effect of running in clean air. On the other hand, a shrinking gap combined with slower laps from the car ahead often points to an undercut in progress. If the pattern flips, you may be looking at an overcut instead.
Once the lap-time trend starts showing tire drop-off, the tire data tells you what’s behind it.
Tire Data, Stints, and What Fans Can Work Out
When the timing screen shows a pace swing, tire data usually tells you why. It helps fans sort out whether the change comes from tire wear, compound choice, or just how long a driver has been on that stint.
What Tire Information Appears on F1 TV
On F1 TV, tire data adds the compound, stint age, and prior compound history to the timing feed. Strategy panels also show who is stretching a stint and who is running an offset plan on a harder compound.
| Displayed Metric | Where Fans See It | What It Tells You During the Race |
|---|---|---|
| Tire Compound | Data Channel / Live Timing | The specific rubber type currently in use; signals grip and expected durability |
| Stint Age (Laps) | Data Channel / Pit Wall | How close a driver is to the end of the tire's optimal window |
| Stint History | Strategy Panels / Timing Feed | Which compounds have already been used; reveals multi-stop or split strategies |
| Sector Deltas | Live Timing Screen | Whether older tires are losing pace compared with earlier laps in the stint |
What Tire Performance Graphics Can and Cannot Show
Broadcast graphics only use visible data: compound, stint age, and lap-time trends. Teams also see carcass temperature, internal pressure, surface temperature, and wear models. Those stay inside the garage.
That gap matters. A driver can look steady on the timing screen for several laps, then the pace suddenly drops. The team may have seen warning signs earlier through data that never appears on the broadcast. So fans have to read degradation the old-fashioned way: through lap-time patterns, sector losses, and how the stint is unfolding. From there, the next clue comes from the driver tracker, which shows where that tire edge shows up on track.
How to Spot an Undercut, Overcut, or Tire Cliff
This is where stint age and sector splits start to pay off. A performance drop-off, often called a tire cliff, usually appears as a sharp jump in sector times, often around 0.5 to 1.0 seconds slower, with no clear reason like traffic or a yellow flag. When that happens on an older set, the tires have probably moved past their best window.
To spot an undercut, compare the out-lap of the driver who just pitted with the in-lap of the car ahead they are chasing. If the car on fresh tires is suddenly putting up much faster sectors, the undercut is working.
An overcut works the other way. The driver who stays out keeps the pace on older rubber, while the car that boxed loses time on the out-lap. Put simply, stint age and sector deltas show who is gaining the upper hand and who is starting to fade. Those tire patterns make the most sense when you line them up with car position and track location, which the driver tracker shows next.
Driver Tracker, Fan Telemetry, and the Limits of the Pit Wall Comparison
What the Driver Tracker Adds to Race Reading
When tire drop-off starts showing up in the timing data, the driver tracker helps you see where it's happening on track. It's a live map of all 20 cars in real time.
Its most useful job is showing where a driver comes back out after a pit stop. Do they rejoin in clean air, or do they come out straight into traffic? That matters a lot, and the tracker makes it easy to spot. It also shows DRS trains, where groups of cars run within one second of each other. That's often why a faster car still can't get through.
And when the TV feed misses a midfield fight, the tracker keeps the story clear. You can follow the gaps closing lap by lap instead of guessing what's happening off-camera.
Which Telemetry Channels Fans Can See
Position shows you where the fight is happening. Telemetry shows you how each driver is handling it.
F1 TV gives fans five core telemetry channels: speed, throttle, brake, gear, and DRS activation status. That set doesn't tell you everything, but it tells you a lot if you know what to look for.
Throttle traces can show how committed a driver is on corner exit. Brake traces can hint at how hard they're attacking corner entry. If the throttle line looks jagged, that can point to rear instability or tire wear. And when a driver short-shifts, it can be a sign they're trying to control wheelspin or save fuel.
Conclusion: What Fans Actually Get from F1 TV Pit Wall Data
F1 TV gives fans strong race-reading tools, but it doesn't give them the deep engineering layer teams use behind the scenes. Here's where that line sits:
| Category | What F1 TV Provides | What Remains Team-Only |
|---|---|---|
| Timing Data | Gaps to leader, intervals, sector splits, and basic lap history | Micro-sector deltas, pace modeling, and fuel load estimates |
| Tracker / Map | Live positions of all 20 cars, pit windows, and traffic pockets | Sub-meter GPS accuracy, traffic flow analysis, and 3D simulation overlays |
| Telemetry | Speed, throttle, brake, gear, and DRS state | Tire temperatures, brake temperatures, ERS deployment and harvesting rates, and suspension loads |
| Strategy Insight | Current tire compound, stint age, and basic pit stop history | Monte Carlo simulations, what-if strategy software, and engine mode settings |
Put those pieces together - intervals, sector trends, stint age, and tracker position - and you can get a very clear lap-by-lap read on the race. You just don't get the deeper engineering layer that stays on the other side of the garage wall.
FAQs
How do I know if an undercut is working?
Check the live timing and telemetry right after the early stop. If the driver on fresh tires starts posting faster sector times and lap times than the rival who stayed out, the undercut is starting to pay off.
Then watch the gap on the timing screen. If that interval is closing fast enough to make up for the time lost in the pit lane, the call is working, especially when the driver has clear air ahead.
What can the driver tracker reveal that timing alone cannot?
Timing screens show gaps, sector times, and track position. The driver tracker adds another layer: it shows where a driver is making up time or giving it away on the track.
That extra context makes the raw numbers easier to read. You can spot the exact corners or sections where time shifts happen, and see how battles, traffic, and driving style shape the gaps on the timing screen.
Which pit wall data remains team-only?
F1 TV gives fans plenty of data, but teams still keep some of it under wraps. That’s how they protect their edge on race day.
Some data is for the team’s eyes only, including secure radio messages, race strategy, pit stop timing, and detailed car telemetry.
Fans usually get the bigger-picture numbers, like speed, tire temperatures, and lap times. But the pit wall’s tactical talk and those split-second strategy calls stay private.