Tire Degradation and Pit Stop Timing in F1
Explains how tire wear, compounds, track conditions and Bayesian models drive optimal F1 pit-stop timing and race strategy.
In Formula 1, tire degradation directly impacts race outcomes. Teams must decide when to pit by balancing the performance loss from worn tires against the 18–20 seconds it takes to complete a pit stop. The wrong timing can cost track position or leave drivers vulnerable to competitors on newer tires.
Key insights:
- Tires degrade due to heat (blistering, graining) and physical wear, slowing lap times.
- Track surfaces, weather, and tire compounds (soft, medium, hard) influence wear rates.
- Advanced mathematical models, like Bayesian state-space methods, analyze lap times, tire age, and environmental data to predict the best pit stop moments.
- Strategies like the undercut (pitting early for fresh tires) and overcut (staying out longer) depend on track conditions and race dynamics.
For example, Charles Leclerc's one-stop strategy at the 2024 Italian GP outmaneuvered a faster McLaren, showing how tire management can outweigh outright speed. Teams constantly adjust strategies mid-race based on real-time data, weather, and events like safety cars. Tire strategy remains a decisive factor in F1 success.
Every F1 Pit Strategy Explained [2026 update]
sbb-itb-7c68254
How Tire Degradation Works in F1
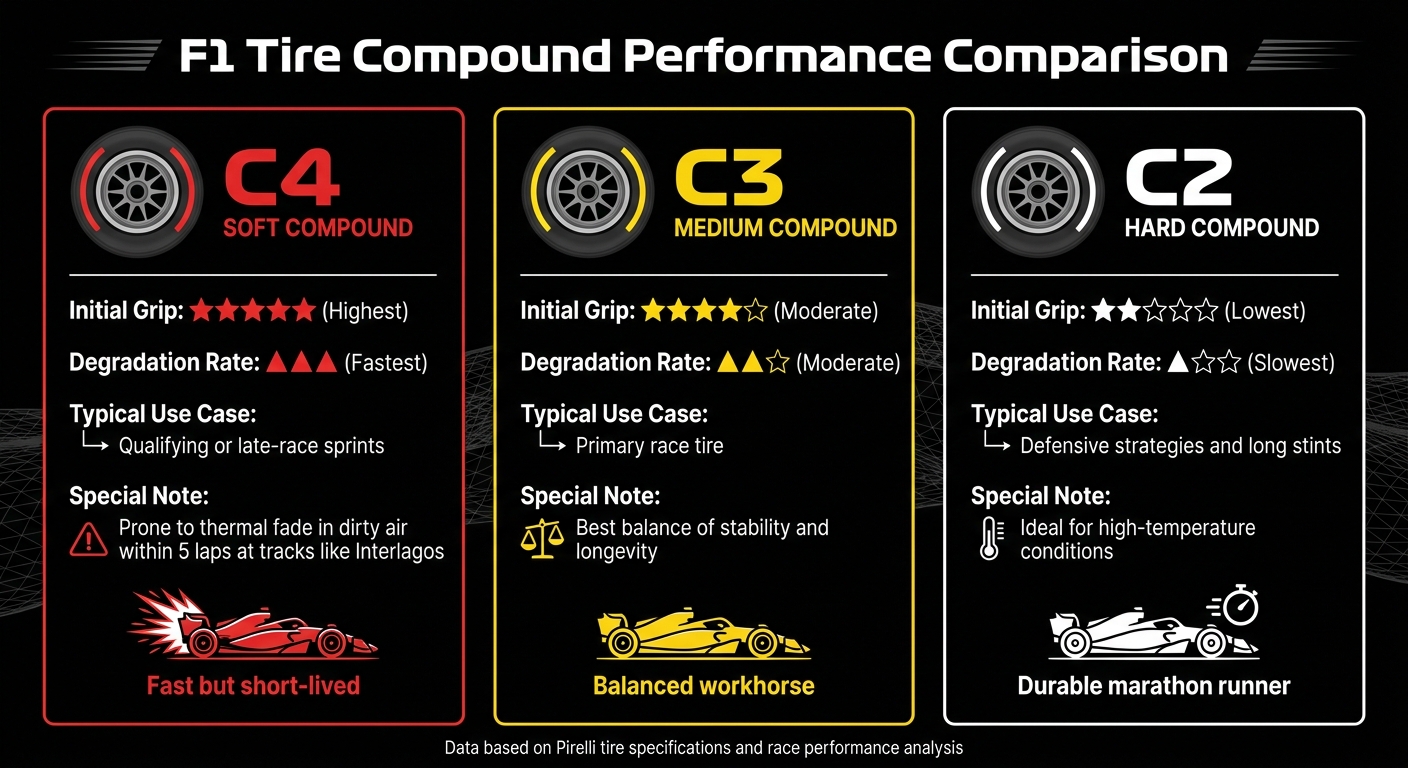
F1 Tire Compounds Performance Comparison Chart
Formula 1 tires endure extreme stress throughout a race, primarily breaking down due to two forces: thermal degradation caused by heat buildup and physical abrasion from the track surface. As the rubber wears down, lap times gradually increase - often by fractions of a second per lap. These small increments can make a big difference over a stint, impacting race positions. Let’s break down how these forces affect tire performance.
Heat and Physical Wear
Heat is a major factor in tire degradation. When tires get too hot, the rubber's polymer chains absorb energy, stretching and creating surface damage known as blistering. On the other hand, if tires are too cold, the rubber stiffens, leading to graining, where chunks of rubber break off. Zara Wang explains this process in Mathematics of Formula 1:
"At high temperatures, the long polymer chains gain thermal energy which leads to an increase in the mobility and flexibility of the chains... When this happens on tyre rubber, it can create a rupture at the surface, also known as tyre blistering."
"At low temperatures, the long polymer chains in rubber lose thermal energy... the chains become ordered and stiff. When this happens on tyre rubber, it can causes sections of the rubber to fall off during the race, also called tyre graining".
Heat also causes internal pressure to rise (P = nRT), which reduces the contact patch - the area of rubber touching the track. A smaller contact patch means less grip, forcing drivers to slow down.
Physical wear from the track surface adds to the problem. Rough asphalt grinds away at the rubber through friction, thinning the tire. As the tire gets thinner, maintaining the ideal temperature becomes harder, accelerating wear even further. During the 2025 Austrian Grand Prix, for example, Lewis Hamilton’s tires degraded at 0.054 seconds per lap on the hard compound and 0.060 seconds per lap on the medium compound. These fractions may seem small, but they add up over an entire stint.
Track and Weather Effects
The characteristics of the track itself play a big role in tire wear. Engineers examine factors like macro-roughness (the spacing of stones in the asphalt) and micro-roughness (the texture of individual stones). Rougher surfaces increase friction and grip but also accelerate wear, especially if the car starts sliding.
Weather conditions are equally important. An overcast day can lower track temperatures by as much as 68°F (20°C) compared to sunny conditions. Cooler temperatures generally help softer compounds last longer but make it harder for harder compounds to reach their optimal range. On the flip side, extreme heat can push cockpit temperatures to between 122°F and 140°F (50–60°C).
Track evolution also has an impact. As cars complete laps, they leave rubber on the racing line, which increases grip over time and reduces wear rates. However, rain or strong winds can wash away this rubber layer, resetting the track to a low-grip "green" state.
Tire Compounds and Wear Rates
Pirelli provides three dry tire compounds for each race weekend: soft, medium, and hard. Each has unique performance and wear characteristics.
The soft compound offers the highest grip and fastest lap times but wears out quickly. For instance, at Interlagos in Brazil, soft tires can overheat and lose performance ("thermal fade") within just five laps if a driver is following another car through the tight middle sector.
The medium compound is the most balanced option. It’s the go-to tire for race stints, offering consistent performance without wearing out too fast. Meanwhile, the hard compound prioritizes durability over speed. Though slower initially, it lasts much longer, making it ideal for strategies like one-stop races or defensive driving in high-temperature conditions.
| Compound | Initial Grip | Degradation Rate | Typical Use Case |
|---|---|---|---|
| Soft (C4) | Highest | Fastest | Qualifying or late-race sprints; prone to thermal fade in dirty air |
| Medium (C3) | Moderate | Moderate | Primary race tire; offers the best balance of stability and longevity |
| Hard (C2) | Lowest | Slowest | Defensive strategies; used for long stints or when track temperatures are very high |
These wear patterns are a key part of the predictive models teams use to plan pit stops and race strategies.
Predicting Tire Wear with Mathematical Models
Formula 1 teams now use cutting-edge mathematical models to predict tire performance loss during races. These models analyze a variety of real-time data points to help strategists decide the best moment for a pit stop. Since tire degradation can't be directly measured mid-race, teams rely on indirect indicators like lap times to infer wear levels.
A popular approach involves Bayesian state-space models, which treat tire degradation as a "latent process" - an unseen factor revealed through changes in lap times. Cole Cappello from Montana State University emphasizes the value of these models:
"Predictive models of degradation can help answer questions such as 'How rapidly do lap times deteriorate?' or 'When does degradation become performance-limiting?'"
Bayesian models have proven more accurate than traditional time-series methods. For example, during the 2025 Austrian Grand Prix, researchers applied this technique to Lewis Hamilton's race data. They found his hard tires degraded at a rate of 0.054 seconds per lap, while mediums wore out slightly faster at 0.060 seconds per lap. The precision of these predictions depends on a wide array of real-time inputs.
Data Used in Degradation Models
Accurate predictions require diverse data points. Teams collect information across several categories:
- Performance metrics: Lap times, sector times, and lap numbers reveal pace decay.
- Tire specifications: The compound type (soft, medium, or hard) and tire age establish the baseline degradation rate.
- Environmental factors: Track temperature, ambient temperature, and weather conditions help predict risks like thermal blistering or graining.
- Vehicle state: Fuel mass, which starts at 110 kilograms and decreases as the race progresses, influences speed. Tire pressure and temperature are also critical, as higher temperatures reduce grip.
- Race context: Variables like pit lane time loss (approximately 18–20 seconds at Interlagos), safety car likelihood, and traffic patterns help determine the best pit stop strategy.
| Data Category | Specific Variables Tracked | Purpose in Modeling |
|---|---|---|
| Performance | Lap times, sector times, lap number | Indicators of pace decay |
| Tire Specs | Compound (soft/medium/hard), tire life | Establishes baseline degradation rate |
| Environment | Track temp, ambient temp, weather | Predicts blistering or graining risks |
| Vehicle State | Fuel mass, tire pressure, temperature | Balances weight-loss speed gains vs. grip loss |
| Race Context | Pit delta, safety car probability, traffic | Optimizes pit windows and strategy adjustments |
Teams distinguish between cumulative degradation (overall lap time loss during a stint) and progressive degradation (lap-to-lap time differences). Top drivers like Max Verstappen and Lewis Hamilton maintain tight progressive degradation ranges - around -0.28 to +0.22 seconds per lap - while mid-field drivers often experience fluctuations over 1.3 seconds. These detailed data inputs form the backbone of the simulation tools discussed next.
Simulation Software and Analysis Tools
Once data is collected, teams use specialized software to refine pit stop strategies. Python paired with the FastF1 API is widely used for real-time data extraction and processing. For statistical modeling, teams rely on Stan, a programming language that uses Hamiltonian Monte Carlo sampling for complex Bayesian models.
Advanced models often incorporate a Skewed T distribution to handle outliers like driver errors or traffic delays, which typically slow lap times. For example, during the 2025 Austrian Grand Prix, this approach achieved a root mean square prediction error (RMSPE) of 0.325 seconds - significantly better than the 0.613 seconds recorded with standard ARIMA models. Teams also utilize Gaussian Kernel Density Estimation (KDE) to visualize lap time patterns and assess driver consistency.
These tools enable strategists to perform scenario analyses, such as evaluating the impact of a safety car or the timing advantage of an undercut (pitting early for fresh tires). At some tracks, the "undercut power" during cooler, low-fuel phases can range from 0.8 to 1.2 seconds. As Zara Wang highlights in her book Mathematics of Formula 1:
"The ability to analyze data in real time has increased exponentially, effectively shrinking the margins teams are actively fighting for on the track".
These predictive models and tools play a crucial role in fine-tuning pit stop strategies during races.
Making Pit Stop Decisions During Races
When teams have their tire degradation models ready and real-time data flowing in, the next big challenge is deciding the perfect moment for a pit stop. This decision is a balancing act: teams weigh the roughly 22 seconds lost during the stop against the performance boost fresh tires provide. For teams, every pit stop is like hitting the reset button - bringing the tire's performance back to its peak before wear sets in again.
This isn't a one-size-fits-all decision. Strategists are constantly analyzing two key metrics: cumulative degradation (the total lap time lost since the stint began) and progressive degradation (how much slower each lap gets compared to the last). For example, at the 2024 Italian Grand Prix, Lewis Hamilton showed an average improvement of 0.065 seconds per lap due to fuel burn-off and careful tire management. This gradual gain can sometimes disguise tire wear, making pit timing even more complex. Additionally, as fuel weight decreases, lap times naturally improve, adding another layer to the decision-making process. This dynamic blend of factors keeps strategists on their toes throughout the race.
Undercut vs. Overcut Tactics
Two common strategies dominate pit stop planning: the undercut and the overcut.
-
Undercut: This approach involves pitting earlier to take advantage of fresh tires, enabling faster lap times and potentially overtaking competitors still running on worn tires. Mario Isola, Pirelli's Racing Manager, explained the undercut's effectiveness at the 2025 Bahrain Grand Prix:
"Those who want to make the most of having extra grip from the Soft for the start will need to pit earlier, between laps 10 and 16 to make the most of the potential undercut advantage, which is very effective at this track".
- Overcut: This strategy focuses on staying out longer to benefit from a lighter fuel load while opponents struggle to bring their new tires up to temperature. A great example comes from the September 2024 Italian Grand Prix, where Charles Leclerc executed a successful one-stop strategy. While Oscar Piastri opted for a second stop, expecting a performance drop from Leclerc, the Ferrari driver maintained consistent lap times of around 83 seconds, neutralizing the advantage of Piastri's fresher tires.
Weather and track conditions can also tip the scales. At the September 2025 Azerbaijan Grand Prix, Max Verstappen's one-stop strategy paid off thanks to cooler-than-usual temperatures. These conditions reduced thermal degradation, making medium and hard tires perform almost identically. As Isola noted:
"The fact it was cooler than usual helped the teams and drivers manage thermal degradation... the Medium and Hard were very close in terms of performance and also in terms of degradation which was practically non-existent".
These contrasting strategies highlight the complexity of finding the ideal pit stop window.
Finding the Best Pit Stop Window
To determine the best time for a pit stop, teams analyze when the time lost in the pits will be outweighed by the performance boost of fresh tires. This calculation involves multiple variables: the current tires' degradation rate, the expected performance of a new compound, fuel load changes, and whether the driver will rejoin in clean air or heavy traffic, which could erase any advantage gained.
Elite drivers tend to show much tighter lap-to-lap performance variations, allowing them to stretch their stints without significant speed loss. At the 2024 Italian Grand Prix, Lewis Hamilton's lap-to-lap times varied between -0.28 seconds and +0.22 seconds, while Max Verstappen's ranged from -0.28 seconds to +0.19 seconds. Compare this to mid-field drivers like Zhou Guanyu, whose times fluctuated between -1.40 seconds and +1.33 seconds. These differences make it easier for top drivers to execute extended stints effectively.
Changing Plans During the Race
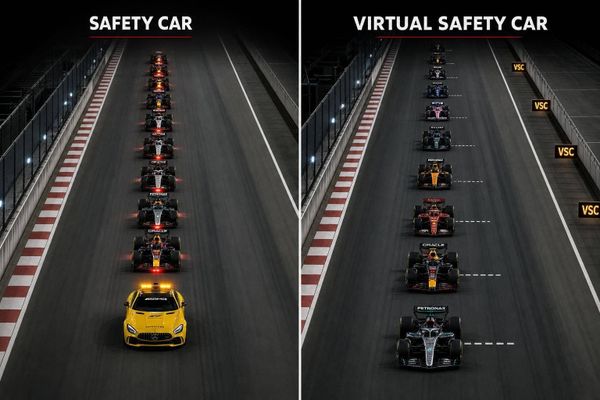
Even with detailed pre-race strategies, teams often need to adjust on the fly due to unpredictable race conditions. Safety cars, virtual safety cars (VSC), sudden weather changes, and competitor strategies can all force teams to rethink their plans. For instance, during a Safety Car period, pit stops take only about 11 seconds instead of the usual 22, creating a window of opportunity that teams are quick to exploit.
Weather changes add even more complexity. When rain looms, teams frequently use a split strategy - pitting one driver for wet-weather tires while leaving the other on slicks. As Box Box Club® described:
"When the weather gods can't make up their minds, teams hedge their bets with a 'split strategy.' One driver pits, the other stays out - someone's bound to be right".
Driver feedback is especially critical in these situations. While advanced weather radars guide decisions, a driver's feel for grip and aquaplaning often determines whether to switch to intermediates or full wet tires. On tracks that dry quickly due to warm or windy conditions, some teams gamble by staying on slicks during light rain, avoiding an extra stop altogether.
The risks of these dynamic conditions were on full display at the April 2018 Azerbaijan Grand Prix. Romain Grosjean's crash while warming his tires under Safety Car conditions highlighted the challenges drivers face in managing tire temperatures during unpredictable moments. For strategists, this means constantly recalibrating pit stop plans, blending data-driven insights with the unpredictable nature of racing.
Race Examples: Tire Strategies in Practice
Building on the predictive models and simulation tools discussed earlier, these race examples demonstrate how strategic pit stop decisions play out in real-world scenarios. Advanced tire degradation models significantly influence how teams craft their race strategies.
One-Stop vs. Two-Stop Races
The 2024 Italian Grand Prix offered a masterclass in tire management. Charles Leclerc's one-stop strategy allowed him to regain track position lost to a competitor who opted for an additional stop. Even though McLaren's Oscar Piastri had a faster car, the extra pit stop cost him valuable time on the track, giving Leclerc the edge.
In contrast, the 2024 Las Vegas Grand Prix highlighted the effectiveness of a two-stop strategy. Severe graining on the Medium compound tires forced drivers to abandon conservative approaches and push harder. George Russell, starting from pole, capitalized on this by employing a Medium-Medium-Hard sequence, which ultimately secured his victory.
These examples show how pit stop frequency and timing can dramatically impact race results, even when outright car performance differs.
Strategy Battles Between Drivers
Driver-to-driver battles often showcase the finer details of tire strategy. At the 2025 Canadian Grand Prix, Max Verstappen (Oracle Red Bull Racing) and Lewis Hamilton (Mercedes-AMG Petronas) engaged in a thrilling duel where thermal management became the deciding factor. Verstappen maintained consistent lap times within a 0.2-second range, while Hamilton's laps fluctuated by 0.5 seconds. This consistency stemmed from Verstappen's ability to keep his tires at an optimal temperature of 94.9°C, compared to Hamilton's slightly higher 95.6°C.
Such head-to-head battles highlight how precise tire management allows elite drivers to extend stints and maintain performance, turning tire degradation into a critical weapon in their arsenal.
| Race | Winner | Pit Strategy | Key Advantage |
|---|---|---|---|
| 2024 Italian GP | Charles Leclerc (Ferrari) | 1‑Stop | Maintained track position with consistent 83-second lap times despite a slower car |
| 2024 Las Vegas GP | George Russell (Mercedes) | 2‑Stop | Pushed hard despite graining; multiple stops were necessary for optimal pace |
| 2025 Canadian GP | Max Verstappen (Red Bull) | Superior Management | Maintained tire temp at 94.9°C; consistent lap times within a 0.2-second range |
These race examples show how data-driven tire strategies not only influence race outcomes but also push teams to refine their approaches to pit stop timing and tire management.
Conclusion
Tire wear and pit strategies are at the heart of every Formula 1 race, shaping outcomes in ways that go far beyond raw speed. Knowing precisely when tire performance dips below acceptable levels - and timing pit stops accordingly - can mean the difference between victory and defeat. This delicate balance often defines the strategies that separate winners from those who fall short.
One clear example of this came during the September 2024 Italian Grand Prix. Charles Leclerc's win highlighted how consistency can trump outright speed. Despite having only the 10th fastest lap, his one-stop strategy allowed him to outmaneuver Oscar Piastri's McLaren. Piastri, forced into a second pit stop, lost valuable time, proving that tire management can sometimes outshine a faster car. As Cole Cappello from Montana State University aptly puts it:
"Deciding to make a pitstop is a delicate balance, and can easily affect a competitor's results".
Modern Formula 1 teams rely on advanced predictive models to navigate these challenges. These systems analyze an astounding 1.1 million data points per second from over 300 sensors on the car. They account for critical variables like the gradual reduction of the 110 kg fuel load over the course of a race. At high-wear tracks like Bahrain, these tools can pinpoint undercut opportunities as early as laps 10 to 16.
Strategic decisions such as undercuts, overcuts, or adaptive pit management can completely alter race dynamics. For instance, the March 2019 Bahrain Grand Prix demonstrated how an undercut - pitting earlier to take advantage of fresh tires - can secure track position and ultimately impact the race result. These split-second calls, guided by real-time data and simulations, are what make strategy so crucial in Formula 1.
Adding to the complexity are environmental variables like track temperature, tire graining, and even cloud cover. These factors can shift the balance between one-stop and two-stop strategies. Teams that can adapt to these changes in real time are often the ones lifting trophies. This fusion of data-driven insights and quick decision-making is what defines championship-winning strategies.
FAQs
How do teams know a tire is “gone” if they can’t measure wear directly mid-race?
Teams use indirect ways to evaluate tire wear during a race. They monitor factors like lap times, sector times, and the number of laps completed since the last tire change. By combining this data with advanced models and historical records, they estimate how much the tires have degraded. When real-time performance dips below predicted levels - based on simulations and live data - teams decide the tires are no longer performing well and schedule pit stops to swap them out.
When does an undercut beat an overcut at the same track?
When drivers aim to gain track position, an undercut strategy can be highly effective. This involves making an early pit stop to switch to fresh tires, allowing the driver to set faster out-lap times compared to a rival still running on worn tires. It works best in situations where tire degradation is severe or when fresh tires offer a clear speed advantage. While overcuts - staying out longer on older tires - can sometimes pay off if maintaining track position is critical, undercuts tend to prevail in scenarios where tire wear plays a big role.
How do safety cars change the “right” pit stop lap?
When a safety car is deployed, it changes the game for pit stop timing. Since all cars slow down significantly, the time lost during a pit stop is much less than under normal race conditions. This creates a strategic dilemma for teams as they consider factors like tire wear, current race position, and the timing of the safety car's appearance.
If a car’s tires are heavily worn, pitting right away can be a smart move. Not only does it save time, but it can also help the driver gain positions once the race resumes. On the other hand, if the tires are still in good condition, staying out might be the better choice. This keeps the team’s options open for later in the race when another opportunity might arise.