Aero Rakes vs Flow-Vis in F1 Tests
Explains how aero rakes deliver quantitative wake data while flow-vis maps surface attachment and why F1 teams use both.
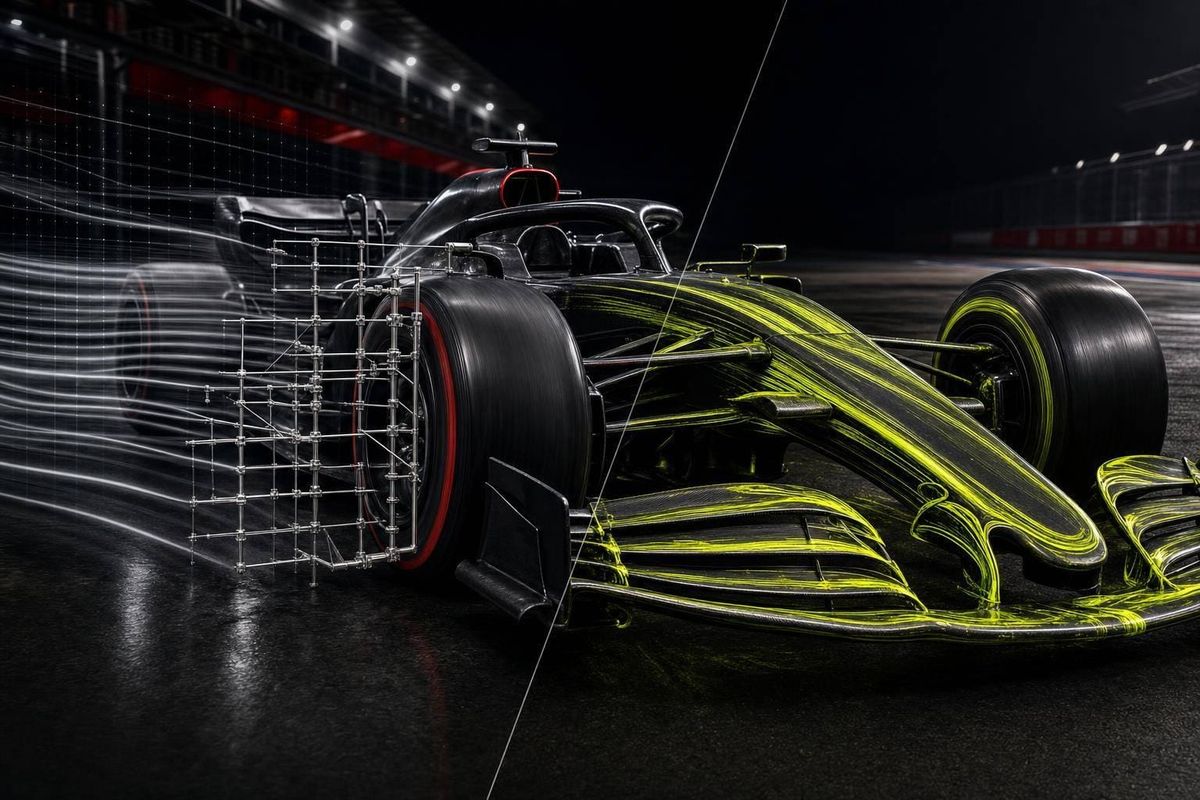
If you want the short answer: F1 teams use aero rakes for numbers and flow-vis for surface patterns. One tells me how much airflow is there. The other shows me where the air stays attached, splits, or separates on the car.
Here’s the whole point in plain English:
- Aero rakes use probe grids to measure airflow around the car
- Flow-vis uses dyed oil to show airflow paths on the bodywork
- Rakes give data like pressure and speed values
- Flow-vis gives marks like streaks, smears, and attachment lines
- Rakes work off the surface
- Flow-vis works on the surface
- Teams use both at the same test because each misses part of the picture
One detail stands out: probe spacing is about 2 inches (5 cm), which gives teams a tight sample grid. But even with that, a rake still cannot show what the air did right on the panel itself. That’s why the dyed oil test still matters.
Bottom line: if I only used rake data, I’d miss surface attachment and separation. If I only used flow-vis, I’d miss pressure and velocity data. In F1 testing, that split shapes setup checks, part tests, and CFD correlation.
Quick Comparison
| Tool | What it gives me | Best for | Main gap |
|---|---|---|---|
| Aero rakes | Quantitative airflow data | Wake, pressure, velocity, vortex position | No direct surface read |
| Flow-vis | Qualitative surface patterns | Attachment, separation, flow direction on bodywork | No hard-number data |
So if you’re comparing the two, the answer is simple: they do different jobs, and that’s why teams run both.
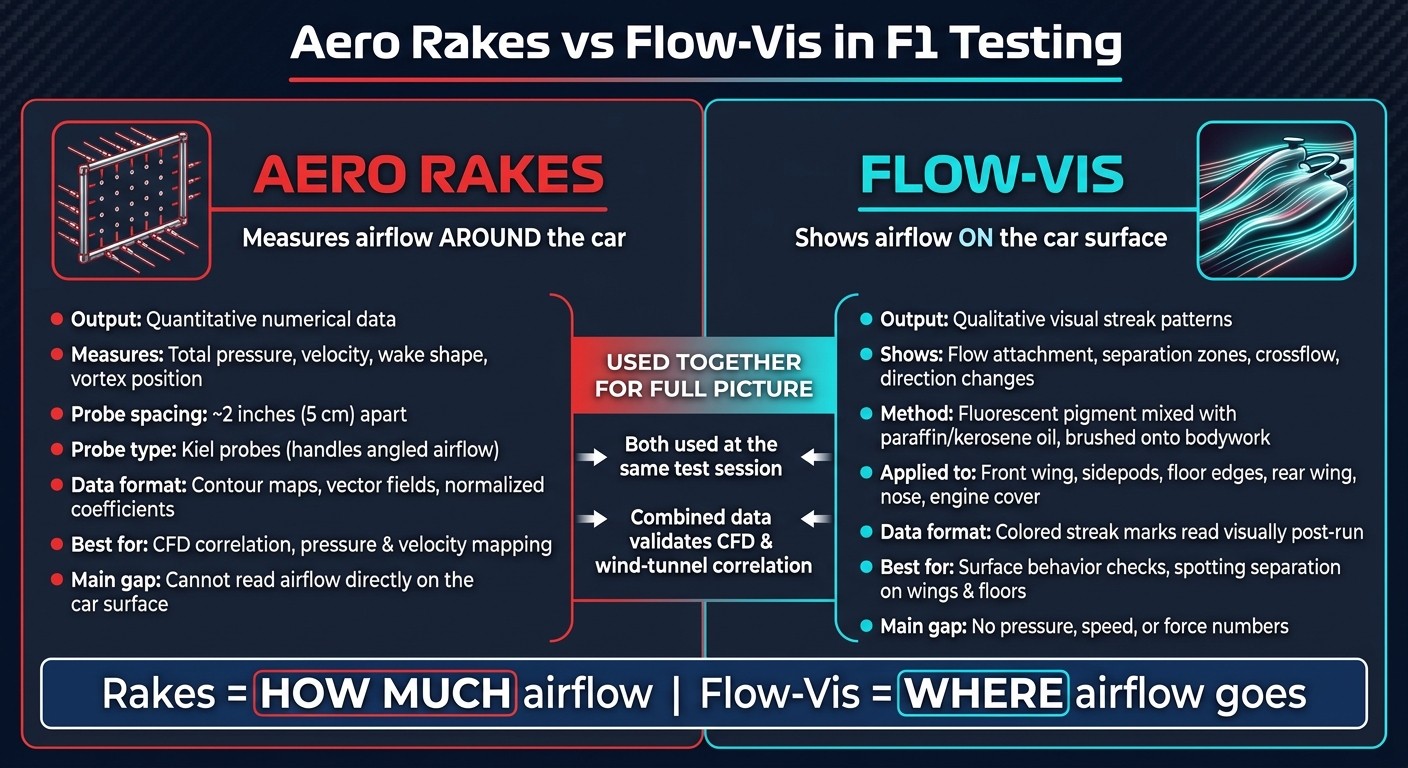
Aero Rakes vs Flow-Vis: F1 Aerodynamic Testing Tools Compared
Aero rakes: What they record and how engineers use them
What aero rakes actually measure
An aero rake is a metal frame with a tight grid of pressure probes mounted to the car during test sessions. The probes sit about 2 inches (5 cm) apart, which gives engineers a detailed sampling grid in the airflow behind or beside parts like the front wing, front wheels, sidepods, or diffuser area.
Most modern F1 teams use Kiel probes instead of old-style pitot tubes. The reason is pretty simple: Kiel probes deal better with angled airflow. Pitot tubes lose accuracy when the air hits them off-axis, and around an F1 car, airflow is rarely neat or straight.
Each probe records total pressure. Engineers then combine that with static pressure and air density to work out local flow speed. Across the whole grid, that gives them a partial map of the flow field. They can see things like:
- velocity distribution
- wake shape
- vortex location
- flow losses behind the car's surfaces
How engineers read rake data at the track
After a run, the pressure signals are synced with car speed, yaw, roll, and track position. That lets engineers study the data corner by corner and lap by lap. Raw pressure readings are turned into normalized coefficients, then shown as contour maps or vector fields. In plain English, those are color-coded plots that show pressure or velocity magnitude, along with flow direction.
Engineers line up the rake layout with CFD and wind-tunnel sampling points, then compare the track data with the predicted flow field. Say a team is testing a new front wing. They'll run baseline laps, swap the part, head back out, and compare both sets of flow maps. They're looking to see whether wake position, outwash strength, and vortex behavior changed the way CFD said they would.
When the flow structures on track line up closely with the simulations, that's a good sign the models are working. If a key vortex appears weaker than expected, or shows up in the wrong place, that can point to a few things. It might be an issue with the part's design. It might come from a setup choice like ride height or wing angle. Or it could hint at a deeper modeling problem, such as how the CFD handles tire deformation or track conditions.
That makes aero rakes great for hard data. But they still can't show what the air is doing directly on the bodywork itself.
sbb-itb-7c68254
What Do Aero Rakes Do And How Did They Help A Formula 1 Team?
Flow-vis: What it shows on the car surface
If aero rakes map the wake, flow-vis shows what the air is doing on the car itself.
Teams make surface flow visible by mixing fluorescent pigment with a light oil, usually paraffin or kerosene, then brushing or spraying it onto selected bodywork areas before a run. Once the car gets up to speed, airflow drags the oil across the surface and leaves colored streaks behind. Those streaks trace the path the air took.
Engineers don't coat the whole car. They use flow-vis on the areas they want to check that day, such as the front wing, sidepods, floor edges, rear wing, nose, or engine cover. That keeps the picture clear and focused on the part under review.
What flow-vis shows that sensors cannot
Aero rakes sample the airflow around the car. Flow-vis shows how that airflow behaves on the surface. That's the key difference.
The streaks can show whether the flow stays attached, where it separates, and when it changes direction. That makes flow-vis especially handy for spotting separation zones on wings, sidepods, and floors.
What it does not give you is pressure, speed, or force data. It's a visual readout, not a hard-number measurement. But that visual readout can still point engineers straight to areas that need a closer look.
How engineers read streak patterns
Smooth, continuous streaks usually mean the flow stayed attached. Broken, smeared, or fan-shaped marks usually suggest separation or crossflow.
Other signs matter too. Pooling, patchy drying, or streaks that bend, split, or fade can mean the flow is changing direction fast or reacting to ride height and yaw. Engineers then compare those patterns with CFD and wind-tunnel predictions. If the streaks match what the models showed, that's a good sign the data lines up. If they don't, something is off and needs checking.
Because the pigment pattern reflects conditions across the full run, the way teams apply it also matters. A thin, even coat, put on the same way every time, makes the post-run read much more dependable.
That's why flow-vis is often the fastest way to check surface behavior before moving to a direct side-by-side comparison with rake data.
Aero rakes vs flow-vis: Best uses, limits, and direct comparison
These two tools do different jobs.
Aero rakes give you numbers. Flow-vis shows you what the air is doing on the car’s surface. At the track, engineers usually need both: wake data and surface behavior. That split matters most when the team has to choose between hard trackside measurements and a direct read of how the flow moves across the car.
Where each tool works best
- Aero rakes: best for pressure and velocity measurements in the wake or airflow around the car.
- Flow-vis: best for checking attachment, separation, and flow direction on specific bodywork surfaces.
Put simply, aero rakes help when the goal is to measure airflow in a way you can chart and compare. Flow-vis helps when you want to see whether the air stays attached, breaks away, or changes direction across a part.
Each method has blind spots, though. And that’s where the trade-off comes in.
Main limits and trade-offs
Aero rakes miss surface behavior. Flow-vis misses hard numbers.
| Attribute | Aero Rakes | Flow-Vis |
|---|---|---|
| Output | Quantitative data | Qualitative streak patterns |
| Best use | Pressure and velocity measurement; CFD correlation | Surface airflow visualization; attachment and separation checks |
That’s why teams rarely use one without the other.
Why teams use both tools together and what that means in practice
Neither tool gives the full picture on its own. Aero rakes measure the wake. Flow-vis shows what the air is doing on the car’s surface. Put them together, and engineers get a much clearer trackside readout.
How both methods support CFD and wind-tunnel correlation
The practical test is correlation: do both methods match CFD and wind-tunnel predictions?
This is where using both tools matters most. Correlation is the check between what teams see at the track and what the simulations said would happen. Rake data gives engineers hard numbers they can line up against CFD outputs, while flow-vis adds the visual check that numbers by themselves can miss.
If rake data and flow-vis don’t line up, engineers go back and check the model, setup, and test conditions. That matters most when teams are trying to keep digital models in step with physics on track.
In practice, teams use both because each one covers what the other can’t see.
Key takeaways
- Aero rakes provide numerical airflow data for CFD and trackside comparison.
- Flow-vis provides a visual check of how airflow behaves on the bodywork itself.
- Each method covers a different gap, so using both gives a more complete picture.
- Combined trackside data helps teams validate CFD and wind-tunnel correlation.
- In modern F1 testing, neither tool replaces the other.
FAQs
Why do F1 teams need both tools?
Teams use aero rakes and flow-vis together because each tool has its own limits. Put them side by side, and engineers get a much clearer read on what the air is doing.
Aero rakes give precise pressure data. Flow-vis, on the other hand, gives a visual look at airflow patterns. One shows the numbers. The other shows the shape of the flow.
Used together, they let engineers compare what they can see on the car with the telemetry coming in from the data systems. That makes it easier to check whether a design is behaving the way their models said it would.
Can flow-vis replace aero rakes?
No. Flow-vis can’t replace aero rakes because each one shows a different side of airflow.
Aero rakes give teams precise, quantitative pressure and flow-velocity data at specific points. Flow-vis paint does something else: it gives a qualitative, visual look at how air moves over the car’s bodywork.
That’s why teams use both. The hard numbers from the rakes and the visual patterns from flow-vis work together, giving engineers a clearer read on what the air is doing.
What can aero rakes miss on the car?
Aero rakes are useful for mapping airflow, but they come with two big trade-offs: they get in the way, and they only show a small slice of what’s happening.
Because teams mount them in specific spots, rakes measure airflow only in that one area. That means they can miss how airflow is interacting across the rest of the car.
There’s another catch. The rake itself can disturb the local airflow it’s meant to measure. So the reading isn’t always a perfect picture of what the car would see without that device in place.
That’s why teams often use flow-vis alongside rakes. Flow-vis helps show surface flow patterns, which gives engineers another way to check what the rake data is saying.