7 F1 Data Platforms Teams Use Today
Breakdown of seven platform layers that move F1 telemetry from trackside to models, with latency, limits, and handoff guidance.
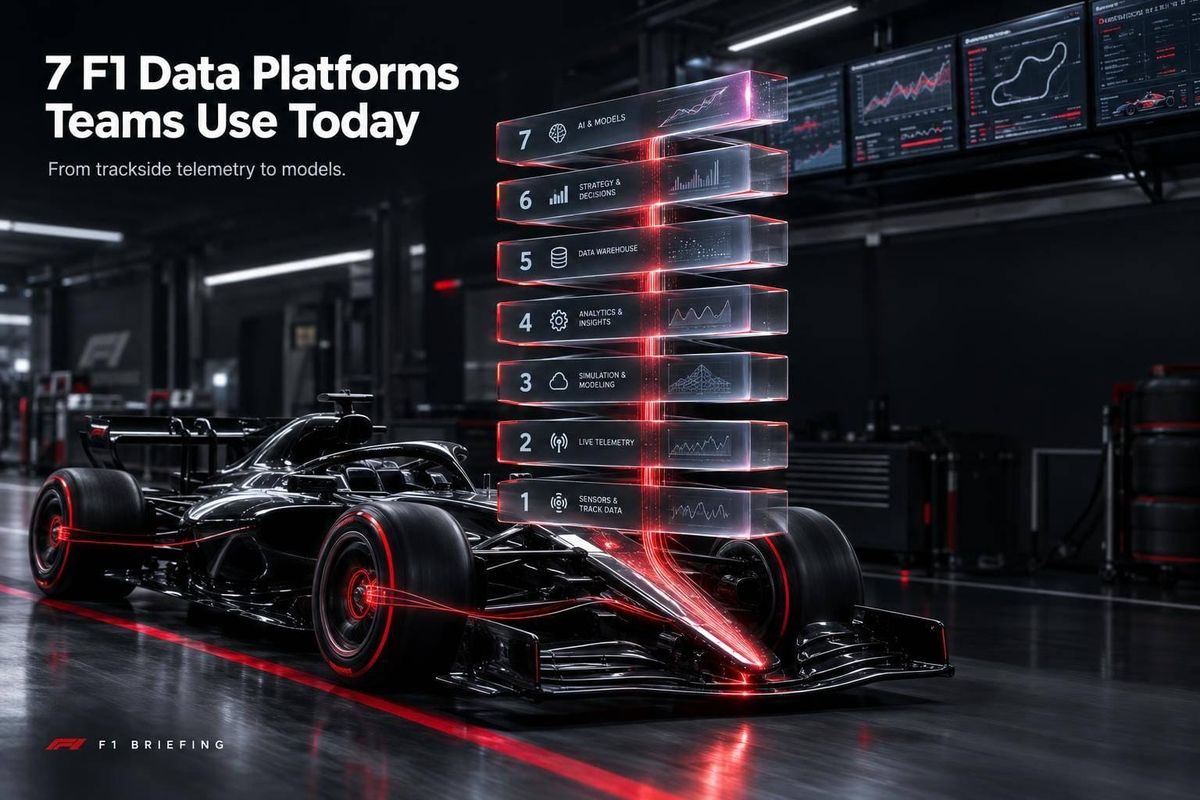
F1 data systems need more than speed: they need the right tools for each decision. Keep urgent alerts trackside, preserve raw data for later checks, and show data age and prediction uncertainty before engineers act.
AWS cites about 300 sensors and more than 1.1 million telemetry data points per second per car, though totals vary by setup and counting method. This guide covers seven platform categories - not seven products every team uses.
Quick Comparison
| Platform category | Main job | Main limit |
|---|---|---|
| Edge storage and trackside computing | Process and buffer data at the circuit | Limited local hardware and storage |
| Time-series databases | Query sensor readings and compare laps | Not suited to large files such as video |
| Object storage and data lakes | Keep raw files, archives, and training data | Retrieval time and metadata requirements |
| Real-time streaming and message queues | Send events and jobs to separate systems | Delays, duplicates, and ordering |
| Cloud analytics and data warehouses | Compare validated data across sessions | Network access, query time, and cost |
| Visualization and observability platforms | Display telemetry and flag data-path faults | Charts can show stale or incorrect data |
| Machine learning and simulation platforms | Test scenarios and estimate outcomes | Results depend on data and model quality |
The guide explains how these layers connect, where each fits, and where each falls short. Public examples do not reveal a team’s complete stack; some describe Formula 1’s broadcast and analytics systems rather than a constructor’s tools.
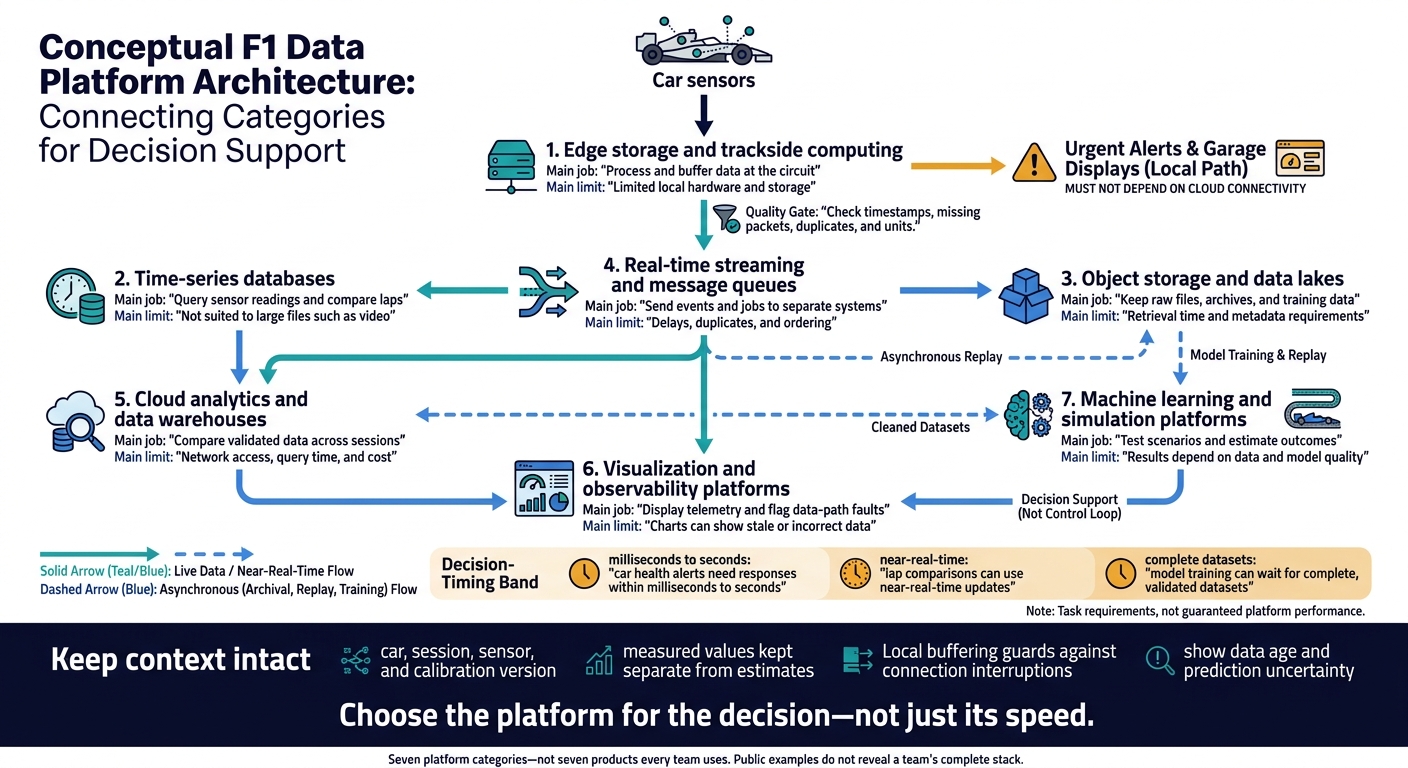
How 7 F1 Data Platform Layers Work Together
How Data Moves Through an F1 Program
F1 data typically follows this path: car sensors → trackside ingestion → streaming → storage and analytics → dashboards and predictive models. At ingestion, systems check timestamps, missing packets, duplicates, and units. Each record should identify the car, session, sensor, and calibration version, with measured values kept separate from estimates.
Each stage maps to one of the platform types covered below.
A streaming layer lets alerting, storage, and analytics use the same events independently. Local buffering guards against connection interruptions. Latency should match the task: car health alerts need responses within milliseconds to seconds, lap comparisons can use near-real-time updates, and model training can wait for complete, validated datasets.
Recent measurements go into a time-series or analytical store for fast queries. Durable object storage holds raw telemetry, setup files, weather, and simulation outputs for replay and deeper analysis. Dashboards should show information suited to each role and flag stale data. Predictive models should return confidence, data age, and model-version details alongside their estimates.
Published organizational example, July 2020: A track signal passed through F1 infrastructure to an AWS endpoint; API Gateway routed the request to Lambda, which updated race state in Amazon DynamoDB before Amazon SageMaker returned a prediction.
Published team example, March 2025: KX described BWT Alpine F1 Team using a real-time data platform running on Microsoft Azure. The stated use cases include on-demand processing, simulation, race strategy, and live telemetry. Treat this as a stated use case, not proof of the exact live deployment.
The pipeline starts at the trackside edge, where buffering and local processing matter most.
sbb-itb-7c68254
1. Edge Storage and Trackside Computing
Data and Workflow Role
Trackside servers take in prioritized telemetry and local circuit data for immediate use. Edge software acts as the telemetry chain’s first filter: it removes noise and prepares live displays of power-unit, tire, and brake data, alongside driver inputs and local weather. Radio bandwidth limits what arrives live, making trackside computing the pipeline’s first decision point.
Latency and Availability
Keep alarms and garage displays local so delays or outages on the factory link don’t interrupt immediate analysis. Local storage preserves telemetry already received during packet loss. It can’t recover readings that never arrived over the radio link. Give critical channels priority over bulk transfers, then send the remaining data upstream for longer retention and deeper analysis.
Red Bull Racing reported in 2025 that it transported edge servers and a mini-data center to each circuit. It distributed telemetry locally and sent about 400 GB per race weekend to its UK headquarters through an AT&T-provided network. Reported Melbourne-to-UK latency was around 300 milliseconds, reinforcing the need for urgent processing trackside.
Scaling and Integration
Portable racks need redundant power, swappable storage, and telemetry testing before shipment. Keep ingestion, processing, and display components separate so teams can upgrade each independently. Package clean, normalized streams for central systems, and give factory engineers secure, role-based access.
Strengths and Limits
Edge computing is a local processing layer, not a full data platform. It gives teams fast local access and reduces remote traffic, but trackside storage and computing capacity have limits. Set clear local retention limits and keep important raw channels centrally for deeper analysis. Normalized streams then move into time-series systems for fast queries and session comparisons.
2. Time-Series Databases
Data and Workflow Role
After trackside filtering, telemetry moves into a time-series store for lap-by-lap comparisons and fast session queries. Alongside each measurement, the database stores the context engineers need: car, session, lap, sector, driver, and channel.
Engineers can query a corner or stint and line up throttle, tire temperature, brake pressure, energy deployment, and lap delta. This supports stint comparisons, tire degradation analysis, and brake mapping. Align corners by circuit distance, not elapsed time, which varies by driver.
Latency and Availability
Live analysis depends on fast ingestion and predictable read performance. Keep each measurement’s original timestamp and data-quality flag, and clearly separate delayed, corrected, or interpolated readings from live values. Test both short-window and full-lap queries while live data is flowing in.
Scaling and Integration
Compression reduces storage use by recording differences between successive samples instead of repeating full values. Keep recent telemetry at full resolution, then apply retention and downsampling rules for each channel. Preserve spikes, not just averages. Index session, car, lap, and time so queries scan the right window rather than the entire archive.
Strengths and Limits
This layer works well for synchronized traces and time-window analysis - not video, CAD assemblies, or large simulation files. Store those assets in object storage or specialized platforms, and link them to the telemetry through references. Raw files and longer-running models belong in object storage, covered next.
3. Object Storage and Data Lakes
When telemetry no longer needs millisecond queries, teams move it into durable object storage for replay, auditing, and model training.
Data and Workflow Role
Object storage holds raw telemetry exports, session records, media, and simulation files. A data lake adds curated datasets for analytics and model training.
Formula 1 stores more than 70 years of historical race data in Amazon S3. That history, combined with current car data, supports tire and race-strategy predictions during the formation lap.
Latency and Availability
Keep archival storage outside the live query path. Copy session data asynchronously for replay and post-session analysis. S3 offers 99.999999999% durability, but that doesn't mean instant retrieval. Cold archive tiers can add retrieval delays. Teams also need clear metadata and retention rules.
Scaling and Integration
Catalog season, event, circuit, session, car, driver, format, schema, and software version. These details let engineers replay a specific session, compare upgrades, or retrain models using the correct version. Use lifecycle rules to move rarely used assets into cheaper tiers while keeping hot data in place.
Strengths and Limits
Object storage supports long retention, many file types, and reuse across analytics tools. The trade-offs are retrieval delays, egress and request costs, and a separate query engine.
Protect reproducibility with versioning for simulation inputs and training snapshots. Use Object Lock when fixed retention is required. Protect sensitive files across exports and derived datasets with identity-based roles, encryption, and access logs. The next layer handles how new events move between these stores in real time.
4. Real-Time Streaming and Message Queues
Data and Workflow Role
Before telemetry reaches long-term storage, streams send live events to separate consumers, while queues deliver individual jobs to workers.
AWS describes Formula 1 using Amazon Kinesis for real-time race data and a Track Pulse architecture in which an Amazon ECS service parses incoming WebSocket feeds, writes processed data to Amazon DynamoDB, and publishes messages to Amazon SQS for downstream processing.
The same events can also feed analytical stores and dashboards without tying every consumer together.
Latency and Availability
Keep urgent alerts separate from bulk processing. Track end-to-end delay - not just broker health. Reconcile delayed events without displaying them as current telemetry.
Scaling and Integration
Partition events by car or sensor group to keep related events in order while processing groups in parallel. Include event IDs, source timestamps, sequence numbers, units, and schema versions. Set limited wait windows for late arrivals.
Check schema changes against active consumers and favor backward-compatible additions. Size capacity for peak traffic and consumer lag, not average demand.
Strengths and Limits
Decoupling lets consumers scale independently. Make consumers idempotent so duplicate events don't trigger duplicate actions. Limit retries and send repeatedly failing jobs to dead-letter queues.
Monitor queue age, duplicates, and data gaps so teams don't mistake a delayed or broken feed for a vehicle problem. The same stream also supplies cloud analytics and warehousing.
5. Cloud Analytics and Data Warehouses
Data and Workflow Role
Once streams reach durable storage, cloud analytics turns validated data into shared historical analysis. It connects lap summaries, setup changes, weather, component records, and simulation results across sessions and seasons.
AWS documents Redshift for warehouse-scale SQL and Athena for querying S3 files directly. These are documented service capabilities, not proof that a particular team uses this exact stack.
Latency and Availability
Use this layer for post-session reviews, overnight analysis, and shared factory-to-circuit access - not decisions that need an immediate response. Network and query latency vary. Keep critical analysis and cached datasets trackside, then sync approved data when connections return.
Scaling and Integration
Publish validated analytical tables with consistent definitions for laps, stints, tires, and vehicle versions. Remote specialists can then compare simulation predictions with track results using the same terms. Elastic compute can expand for preseason simulation analysis or large historical queries, then shrink afterward.
Strengths and Limits
Telemetry analytics engines suit high-volume time-series analysis. Redshift fits repeated historical joins, while Athena fits occasional S3 queries. A demonstration alone does not prove that a particular F1 team uses a service in production.
Shared access still requires clear ownership, data lineage, encryption, and restricted permissions.
AWS Lake Formation supports row-, column-, and cell-level controls.
Cloud costs need attention, too. Partition and compress datasets, set retention policies, and monitor scanned data and compute runtime. Repeated archive scans, duplicate copies, and data transfers can wipe out elastic-compute savings.
Those curated datasets then feed dashboards and observability tools.
6. Visualization and Observability Platforms
Data and Workflow Role
Once data is validated and stored, teams use dashboards and alerts to put it to work. Grafana connects to Azure Data Explorer (ADX), letting teams query and display metrics, logs, and traces through KQL or the visual query builder. It turns curated telemetry into role-specific views for live decisions.
Keep calculations in upstream services, quality checks in validation jobs, and display in Grafana. The integration is documented, but the supplied sources do not establish that a named F1 team uses it.
Latency and Availability
Show event time, last ingestion, last query, and a live/delayed/stale status. Track transmission delay separately from query runtime and dashboard refresh scheduling.
Match the update frequency to the decision: frequent updates for live monitoring, slower updates for trends. Too many refreshes add backend load. Test what happens when the network drops, and make stale data unmistakable. Engineers should check whether the data is current before trusting the chart.
Scaling and Integration
Build views for race engineers, performance engineers, and reliability staff. Grafana variables let users switch cars, sessions, and components without duplicating dashboards.
Keep clocks synchronized, store event time separately from ingestion time, and use consistent event IDs so traces and annotations line up. Reuse queries, narrow time ranges, version dashboards, and monitor ADX query time, concurrency, and throttle limits.
Strengths and Limits
Grafana connects signals with the context engineers need - it does not prove that a sensor is correct. Its ADX integration supports query-based alerts with conditions, evaluation windows, labels, and notification routing.
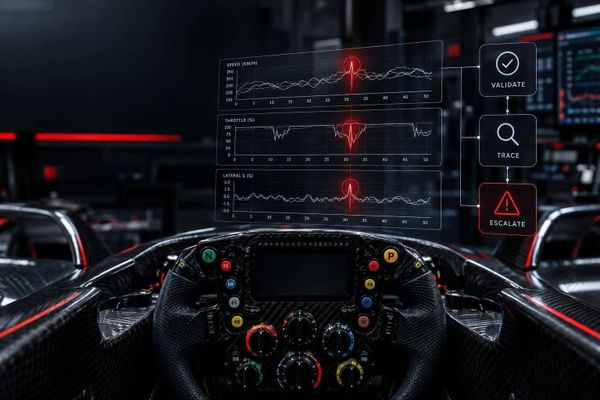
Set thresholds for each component and operating mode. Define duration thresholds, hysteresis, missing-data behavior, and who owns each escalation. Alerts and synchronized charts help engineers interpret data, but they cannot fix missing or bad telemetry.
7. Machine Learning and Simulation Platforms
After dashboards flag anomalies, ML and simulation help estimate what happens next.
Data and Workflow Role
ML and simulation turn cleaned, prepared telemetry into support for next-step decisions. SageMaker handles model development and serving, simulation tests assumptions, and monitoring flags changes in live data. All three rely on the cleaned, versioned datasets built upstream.
Tire-degradation forecasts can feed pit-window simulations. Anomaly scores can flag unusual telemetry, while component failure-risk models estimate failure probability. Treat these outputs as decision support unless a team has published otherwise.
AWS documented a Formula 1 workflow using timing, tire, and weather inputs stored in Amazon S3, historical race replay to identify live-available features, and XGBoost training and serving in SageMaker. The workflow updated predictions as race conditions changed.
Timing matters: a useful prediction must arrive before the decision window closes.
Latency and Availability
A live strategy call may need an answer within seconds. Setup sweeps and reliability studies, on the other hand, can take minutes or hours.
F1’s documented application updated race state in DynamoDB and triggered predictions through an event-driven workflow.
Keep local fallback logic ready if cloud access fails, and give each prediction an expiry time. With timing requirements set, teams can spread workloads across scenarios and versions.
Scaling and Integration
Run tire, pit-lap, weather, and setup scenarios in parallel to support strategy, setup, and reliability choices. Set clear compute limits and queue priorities. ML can also rank candidates before teams commit resources to expensive simulations.
AWS documented this approach for F1 aerodynamic geometry studies in 2022.
Align training data by timestamp and validate models on held-out races. Exclude future stint outcomes and post-race diagnoses to prevent data leakage - using information that wouldn't have been available at prediction time.
Version data snapshots, features, model weights, software, simulator settings, and assumptions so engineers can reproduce each recommendation.
Strengths and Limits
These platforms speed up pattern finding and scenario screening. But rare failure cases - and changes to cars, tires, or regulations - can weaken forecasts.
Report uncertainty ranges and calibration quality, not just average accuracy. Separate sensor noise from model uncertainty and weather assumptions, and use feature importance and sensitivity tests to explain outputs. Validate predictions before using them in operations. Engineers must retain authority over pit calls, setup changes, and component-risk decisions.
Comparison: Platforms by Engineering Task
Choose the platform for the decision - not just its speed.
Each of these seven platform layers handles a different job. The table maps them to engineering tasks, along with their limits and typical users.
| Platform category | Primary data handled | Latency profile | Scaling behavior | Strongest F1 use case | Principal limitation | Typical users |
|---|---|---|---|---|---|---|
| Edge storage and trackside computing | Raw telemetry buffers, local events, video, session files | Immediate processing near the car | Limited by trackside hardware, power, storage, and bandwidth | Buffer and filter session data when remote links are constrained | Finite capacity; remote synchronization relies on connectivity | Race engineers, reliability specialists, trackside IT |
| Time-series databases | Timestamped tire, brake, power-unit, suspension, and aerodynamic measurements | Immediate to near-real-time queries | Partitioning and retention policies help manage growing signal histories | Compare telemetry against reference laps and component trends | Longer retention and more distinct signals make queries and storage harder to manage | Race engineers, performance analysts, reliability specialists |
| Object storage and data lakes | Telemetry archives, simulation files, setup files, logs, historical race data | Near-real-time ingestion; analysis usually runs in batches | Elastic storage spans race weekends and seasons | Keep complete datasets for factory analysis and replay | Requires reliable metadata, governance, and retrieval planning | Factory teams, performance analysts, data engineers |
| Real-time streaming and message queues | Telemetry events, alerts, lap markers, timing and weather changes | Immediate to near-real-time delivery | Partitions and parallel consumers increase throughput | Send live events to engineering and strategy systems | Ordering, duplicate handling, replay, and backpressure require careful management | Strategists, race engineers, reliability specialists, software engineers |
| Cloud analytics and data warehouses | Cleaned historical records, joined race data, aggregated performance metrics | Near-real-time or batch, depending on ingestion | Elastic compute and storage support broad analytical queries | Compare performance across sessions and combine engineering datasets | Network dependence, transfer costs, and data-modeling overhead | Performance analysts, strategists, factory teams |
| Visualization and observability platforms | Dashboard metrics, alerts, logs, traces, infrastructure health | Immediate to near-real-time; depends on how current upstream data is | Scales with monitored systems, users, and query load | Give engineers shared views and detect data-path failures | Stale metrics, weak thresholds, and alert fatigue can hide problems | Race engineers, reliability specialists, strategists, IT teams |
| Machine learning and simulation platforms | Prepared features, scenario inputs, trained models, prediction and simulation outputs | Batch training and large simulations; live inference latency varies by workload | Cloud or high-performance computing expands parallel workloads | Test strategy options and engineering scenarios | Model fidelity, representative inputs, and compute cost | Strategists, performance analysts, reliability specialists, factory teams |
Conclusion: How the Platforms Work Together
Handoffs matter as much as platforms: edge systems and streams handle live data; time-series databases and archives support retrieval; cloud analytics enables comparisons; and dashboards, models, and simulations help guide decisions. Together, they turn raw telemetry into decisions while keeping its context intact.
Historical archives allow reliable replay and comparison only when session metadata ties records to the correct car, setup, and weather.
The practical rule is traceability: keep timestamps and session identifiers, buffer data during connection outages, store raw records separately from cleaned datasets, and show data age and model uncertainty on dashboards.
Public F1 documentation supports this layered model, but much of it describes broadcast and analytics infrastructure - not a constructor’s complete stack. Teams’ schemas, algorithms, and operating thresholds remain largely confidential. Assess the stack by latency, connectivity, integration, governance, cost, and model uncertainty, giving priority to platform roles and handoff quality rather than raw speed alone.
FAQs
How do teams choose which telemetry to transmit live?
Formula 1 teams give priority to telemetry that directly affects race performance and vehicle health. With limited bandwidth, onboard systems compress and pre-process sensor readings, filtering out less urgent information so critical data gets through first.
Engineers use this data to make quick decisions, from adjusting pit stop timing to fine-tuning hybrid energy recovery. Detailed data remains available for later analysis.
How do engineers resolve conflicting sensor readings?
Engineers use real-time stream processing frameworks to filter out unusual sensor readings and calculate derived metrics before the data guides decisions. Catching corrupted readings at the source helps teams avoid mistakes, such as unnecessary pit stops.
Teams also use message brokers like Apache Kafka to buffer and manage telemetry streams. These brokers keep data flowing reliably when analytics tools fall behind on processing.
How do teams validate predictions after car upgrades?
Teams compare real-time track telemetry with baseline performance data in their analytics platforms. They also check it against predictions from computational fluid dynamics simulations, wind tunnel tests, and driver-in-the-loop simulators.
Engineers use ATLAS or custom MATLAB and Python workflows to see whether sensor readings, such as aerodynamic loading and engine efficiency, match those predictions. They also review historical data to confirm that upgrades deliver the expected gains.