How F1 Teams Read Telemetry Outliers
Telemetry outliers are clues, not diagnoses: how F1 engineers validate signals, trace causes, and escalate safety risks.
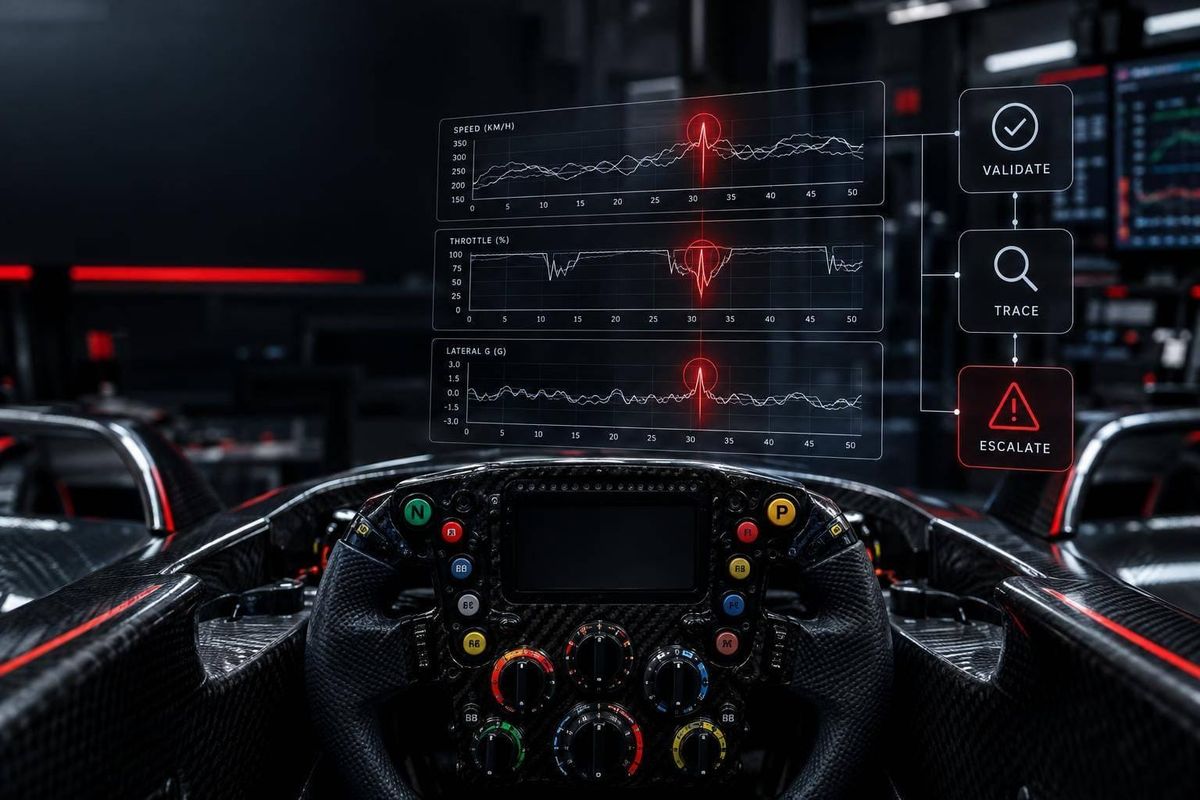
An unusual telemetry reading is a clue - not a diagnosis. F1 engineers compare several clean laps, check sensor data, and find which signal changed first. A wheel-speed drop before a steering correction, for example, points to different checks than the reverse sequence.
The next step depends on context: testing setup changes in practice, checking tire preparation in qualifying, or tracking time loss during a race. Teams weigh the risk and confidence in the data before choosing to monitor, advise the driver, pit, or stop. A suspected safety issue can require action before the cause is confirmed.
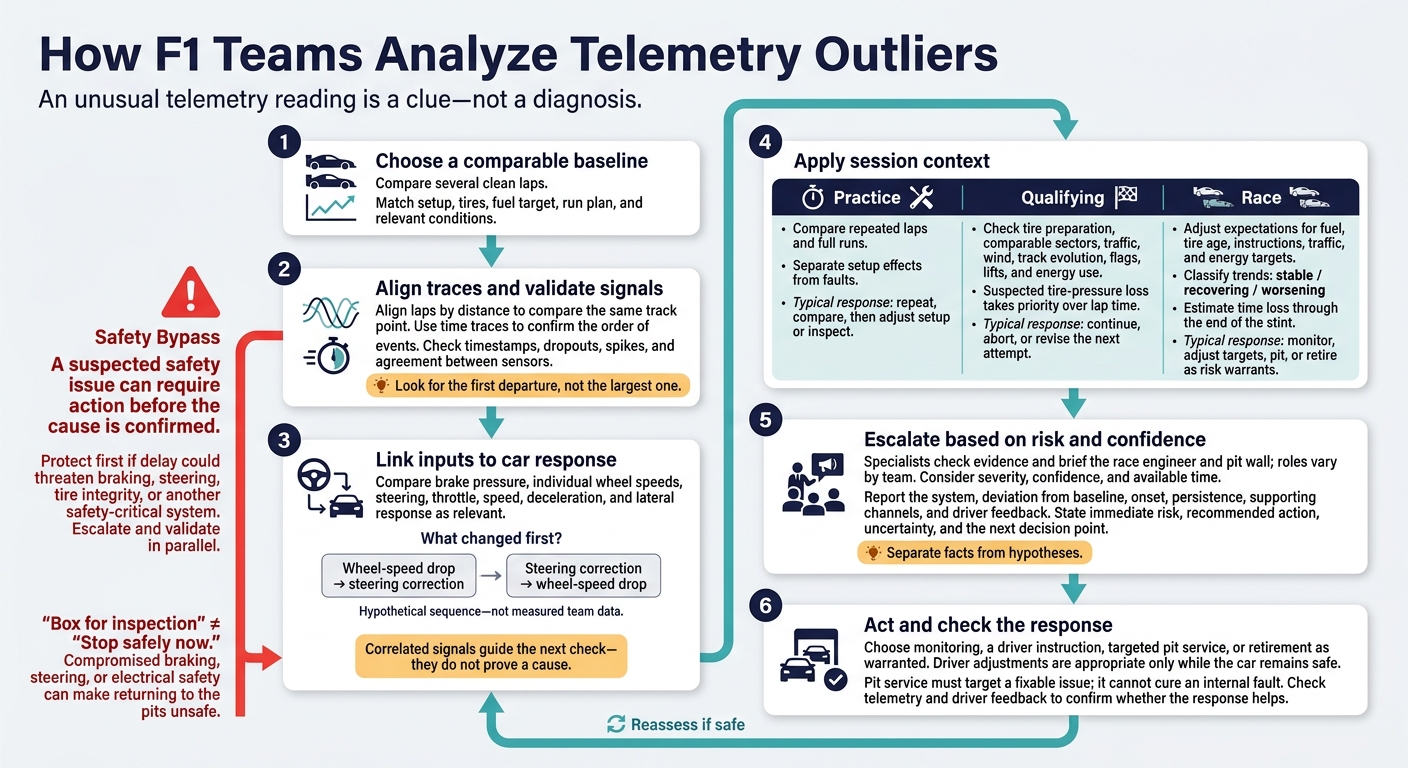
How F1 Teams Analyze Telemetry Outliers
Find Where the Deviation Starts
Align Lap Traces and Check Signal Quality
With the baseline set, align the traces to see where the car first departed from it.
Look for the first departure, not the largest one. Align laps by distance to compare the same track point. Follow the traces from the corner the driver identifies through corner exit, then use time traces to confirm the order of events. Before treating a change as car behavior, check timestamps, dropouts, spikes, and agreement between sensors.
The order of the channel changes matters more than the size of a spike.
Hypothetical trace overlay - not measured team data: Through corner entry, the reference and current speed traces overlap.
This identifies the first departure - not its cause.
Check the laps before and after it to see whether the deviation repeats. One-off and repeated changes call for different checks, but either may indicate a fault. Compare teammate data and track conditions when relevant. Shared behavior may support a track-related explanation, but it doesn’t prove one.
Link Braking, Steering, and Throttle to Car Response
Once you’ve found the first departure, match driver inputs to the car’s response. Did braking change before entry speed and deceleration changed? Did steering corrections come before a change in lateral response?
If throttle application hesitates, check whether individual wheel-speed changes came first rather than assuming poor traction. Steering angle alone cannot diagnose the issue. Check brake pressure and wheel speeds for signs of locking before the correction, especially when braking and turning overlap.
Hypothetical signature What changed first? Channels that establish the sequence Follow-up check Wheel speed falls sharply during braking Brake application or wheel-speed drop? Brake pressure, other wheel speeds, deceleration Check signal continuity and the entry line Extra steering without the expected lateral response Steering input or reduced lateral response? Steering, speed, lateral acceleration Compare a clean lap at similar entry speed Throttle hesitation with rear wheel-speed variation Rear wheel-speed variation or throttle reduction? Individual wheel speeds, throttle, steering Trace backward to braking and corner entry If poor traction continues after the entry phase Entry sliding or exit wheelspin? Wheel speeds, tire temperatures, lap delta Compare subsequent corners and laps
An entry error may come before poorer traction during combined cornering and acceleration. Looking only at the exit can therefore miss the trigger. Use driver feedback to help piece together the sequence, while treating correlated signals as pointers for the next check - not proof of a cause.
sbb-itb-7c68254
Read Outliers in Session Context
Session context shapes the next decision. After the first deviation appears, the team’s response depends on the session goal and the time left.
| Session | Baseline | What to watch | Key risks | Typical response |
|---|---|---|---|---|
| Practice | Matched setup, tires, fuel target, and run plan | Repeated laps and full runs | Setup effects mistaken for faults; progressive safety issues | Repeat, compare, then adjust setup or inspect |
| Qualifying | Clean sectors under planned tire prep and energy use | Current run and comparable sectors | Tire-window issues, pressure loss, traffic | Check context; continue, abort, or revise the next attempt |
| Race | Expected pace adjusted for fuel, tire age, instructions, traffic, and energy targets | Trends across laps and stints | Damage, degradation, overheating, energy shortfall, time loss | Monitor, adjust targets, pit, or retire as risk warrants |
Practice: Separate Setup Effects From Faults
Tag each run with its setup version, tire compound and age, fuel target, energy mode, driver instructions, and traffic. Compare repeated laps within that run before comparing configurations.
Treat an isolated deviation as a reason to check run quality and a progressive change as a possible fault trend. A setup-linked change counts as expected only if it repeats after the adjustment. Record when the change began and what the next controlled test should change.
Don’t wait for repetition if a reliable reading crosses a team-defined alert band. The same trace tells you less if the lap involved one-off tire prep or traffic.
Qualifying: Check Tire Preparation and Run Conditions
Compare the clean sector or lap against the tire prep plan and a comparable run on the same compound. Aggressive warm-up can help the opening sector but overheat the tires later in the lap. Gentler prep can do the opposite.
Check traffic, wind, track evolution, flags, lifts, and energy use before calling it a fault. Suspected tire-pressure loss takes priority over lap time. For noncritical overheating or deployment shortfalls, decide whether a brief instruction can save the lap - or whether aborting protects the next attempt. In race trim, that same outlier matters less on its own than as part of a trend.
Races: Track Trends and Time Loss
Match radio instructions with driver inputs. Slower pace after a fuel-save request isn’t the same as lost speed despite unchanged demand. Check pressure, temperature, vibration, tire performance, and energy data against traffic and fuel targets.
Classify the trend as stable, recovering, or worsening, then estimate its time cost through the end of the stint. Change strategy only if it addresses the cause and saves more time than the pit stop and traffic would cost. Escalate a worsening safety concern immediately. If the trend points to growing risk, take it to the pit wall.
Decide When to Escalate to the Pit Wall
When a trend worsens or points to a safety risk, the task shifts from diagnosis to escalation. Specialists check the evidence, then brief the race engineer and pit wall. Roles vary by team, so the person diagnosing the issue may not make the call. Urgent safety warnings bypass routine checks.
Match the Response to Risk and Confidence
Follow this sequence: observe, verify, inform, protect, act. Check signal quality and supporting channels, but protect first if a delay could threaten braking, steering, tire integrity, or another safety-critical system. Each team sets its own thresholds.
| Finding | Severity | Confidence | Available time | Response |
|---|---|---|---|---|
| Possible safety-limit breach | High | Low to high | Seconds | Give a protective instruction; escalate and validate in parallel |
| Confirmed or strongly supported limit breach, with immediate risk under control | High | High | One sector to one lap | Apply approved protection; decide whether to pit |
| Worsening trend | Potentially high | Medium to high | Several laps, if safe | Inform decision-makers; set a review point and prepare action |
| Linked-channel anomaly | Depends on system | Medium to high | One or more laps, if safe | Use supporting data and driver feedback to choose a targeted response |
| Unexplained time loss, safety channels normal | Performance concern | Low to medium | Several laps | Investigate before recommending tactical action |
Once you've chosen a response, put the finding into one clear message for the race engineer.
Report the Problem and Recommend a Response
Give the race engineer enough detail to make a decision: the system, deviation from baseline, when it began, how long it has persisted, supporting channels, and driver feedback. Separate facts from hypotheses. Then state the immediate risk, recommended action, uncertainty, and next decision point.
Telemetry informs the instruction; the driver makes the adjustment.
Choose Driver Adjustments, Pit Service, or Retirement
Use permitted mode changes, brake-balance tweaks, reduced pace, or tire management only while the car remains safe. Check the trace to confirm that the response helps. Pit service must target a fixable issue, such as tire damage or a cooling blockage - it cannot cure an internal fault. Request feedback or a diagnostic lap only when the car remains safe and the test has a clear purpose.
Separate “box for inspection” from “stop safely now”: compromised braking, steering, or electrical safety can make the car unsafe to return.
Conclusion: Check the Signal and Act on Risk
Choose a comparable baseline, validate the reading, link inputs to response, and account for session context. Escalate based on risk and confidence, but act on a well-supported safety warning before completing the diagnosis.
FAQs
How do F1 teams set telemetry alert thresholds?
F1 teams set telemetry alert thresholds using a baseline model built from thousands of simulated race scenarios. The model accounts for tire wear, fuel loads, and conditions such as weather. Engineers then compare live data with those thresholds to spot signs of mechanical or electronic failure.
Unsupervised machine learning algorithms, such as Isolation Forest, also flag unusual patterns automatically. These alerts help engineers address problems before they cause failures that stop the car from running.
How do engineers update baselines as track conditions change?
Before a race weekend, engineers use historical data - including tire degradation and time lost during pit stops - to set baselines. Once the car hits the track, real-time telemetry feeds predictive models with tire temperatures, fuel flow, and GPS-based sector times.
Teams combine radar, driver radio, and sector deltas to track changing conditions. When the data moves away from the baseline, machine learning and digital twin simulations help them adjust pace targets or pit windows.
What happens when telemetry conflicts with driver feedback?
When telemetry and driver feedback don’t line up, F1 teams cross-check several signals instead of trusting one source. Engineers compare what the driver feels with sector-by-sector lap time differences, tire degradation data, and onboard video. When pace changes, sector times, and visible sliding back up the driver’s report, the pit wall can work out whether the issue reflects a performance limit or an outlier.