F1 Waste Reports: What Paddock Data Shows
Paddock waste reports often equate collection with recycling; this article reveals verification gaps and needed standard metrics.
I can’t rank paddock waste results for Singapore, Australia, or Hungaroring from the available reports as of October 19, 2026. Before comparing them, I’d check what each report covers and ask for weight records and final processing records - not just bin totals.
Here’s what I’d look for:
- Packaging: Items issued, returned, and reused, plus what happened after collection.
- Food: Separate counts for prep waste, edible surplus, and plate waste, with donations counted within surplus.
- Recycling: Weights collected, sorting losses, and final recycled output.
The missing records matter: the cited Hungaroring 2025 source pages returned 410 Gone errors, leaving those totals unverified. My bottom line: <u>collection is not proof of recycling</u>, and team-level figures can’t stand in for a whole Grand Prix.
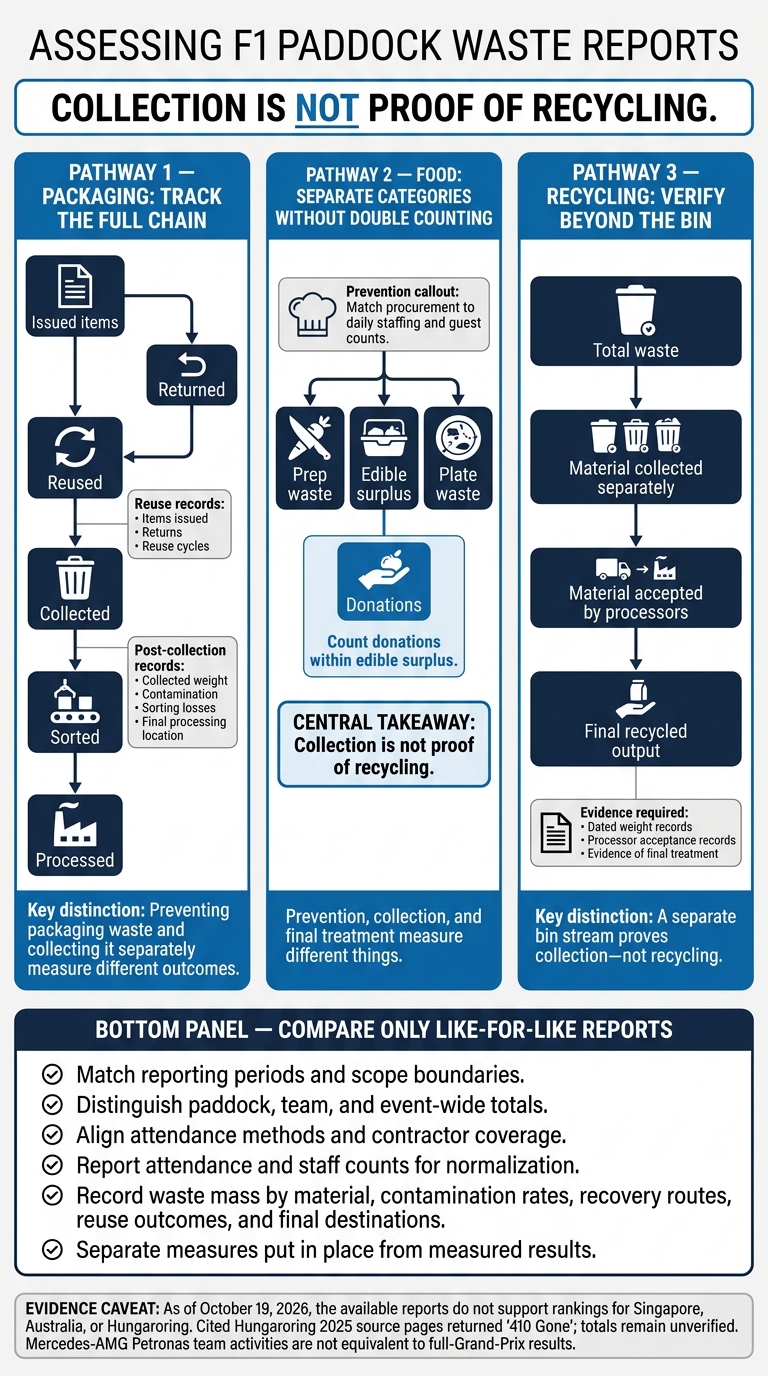
F1 Waste Reporting: From Collection to Verified Outcomes
Packaging: Reducing Waste and Improving Collection
Preventing packaging waste and collecting it separately measure different outcomes. Refill systems and repeated reuse can reduce purchases of disposable items. But packaging issued, returned, and collected can tell different stories.
Singapore and Australian Grand Prix Packaging Measures
The material does not establish packaging performance across the full chain: issued → returned → reused → collected → sorted → processed. It also does not distinguish paddock activity from event-wide totals, so the data cannot support paddock-specific conclusions.
Measuring Reuse and Confirming Recycling
Reuse can be tracked when items are issued and returned; recycling must be traced after collection. Reuse reports should show the number of items issued, returns, and reuse cycles.
A separate bin stream proves collection - not recycling. Reports should include collected weight, contamination, sorting losses, and the final processing location.
sbb-itb-7c68254
Food Waste: Prevention, Donation, and Treatment
Food waste has the same reporting problem as packaging: prevention, collection, and final treatment measure different things. Prevention starts with procurement. Match orders to daily staffing and guest counts, then prepare only what you expect people to eat.
Hungaroring and Mercedes Food-Recovery Results
Hungaroring reports on hospitality waste at the event level. Mercedes-AMG Petronas reports on team activities - not the full Grand Prix. These different scopes mean headline totals can’t be compared directly. Reporting categories offer a more useful way to assess the results.
Tracking Where Food Waste Goes
Food-waste reports should separate prep waste, edible surplus, donations, and plate waste. Count donations within edible surplus, rather than adding them again to the total. Comparing paddocks and tracking results year over year requires consistent scope and category definitions.
Waste Totals and Gaps in Recycling Data
Collection data alone don’t prove recycling. A report needs to distinguish total waste, material collected separately, material accepted by processors, and final recycled output. Hungaroring 2025 shows where verification falls short.
Hungaroring 2025 Waste Totals
The primary source pages for the 2025 Hungaroring waste reports returned 410 Gone errors. Without the original report, the totals remain unverified.
Comparing Event Reports Without Rankings
Reporting periods, scope boundaries, attendance methods, and contractor coverage can all change reported totals. Rankings aren’t reliable until those definitions match. Request dated weight records, processor acceptance records, and evidence of final treatment.
Conclusion: Findings and Reporting Gaps
The available reports describe changes to packaging, reuse, food rescue, and sorting - but they don't verify paddock-level recycling outcomes. They often count collected material as recycled without clarifying where it went or how it was recovered.
Different reporting boundaries and missing destination data make comparisons unreliable. Future reports need a shared minimum set of metrics so comparisons rest on the same basis.
Minimum Data for Future Paddock Reports
Each report should define its scope and coverage, along with attendance and staff counts, so results can be compared on a normalized basis. It should also report waste mass by material, contamination rates, recovery routes, and reuse outcomes.
Reports should name the final destinations for recovered material and separate measures put in place from measured results.
FAQs
How can I compare waste per attendee across races?
Calculate waste per attendee by dividing each Grand Prix weekend’s total waste by its official attendance. Use either pounds or kilograms throughout, and break waste down by stream, such as recycling, compost, and landfill.
Keep paddock waste separate from spectator waste, since hospitality and event operations affect paddock totals. Before using the ratio to compare sustainability performance, account for reporting gaps and differences in what each venue measures.
When does reusable packaging reduce overall waste?
Reusable packaging cuts overall waste when it replaces single-use items in manufacturing and logistics and holds up through repeated use. McLaren, for example, has replaced single-use plastics in production with bio-based vacuum bags.
Teams are also working on material reuse and full lifecycle management, following guidance in the F1 Constructors' Circularity Handbook, to rely less on disposal.
What evidence would verify F1 recycling claims?
Verification starts with standardized, measurable data. Frameworks such as the F1 Constructors' Circularity Handbook help track material lifecycles and circularity rates, including McLaren’s 37% benchmark for 2024.
Claims of a reduced environmental footprint need evidence: documented lifecycle emissions reductions from recycled components, verified weight savings from bio-based materials, and supply chain data that can be audited. That includes records of shifts from air to sea freight.