How Lap Timing Impacts F1 Race Strategies
Explains how rolling lap times, sector splits, gaps and Safety Car/VSC change pit windows, undercuts/overcuts and tire calls.
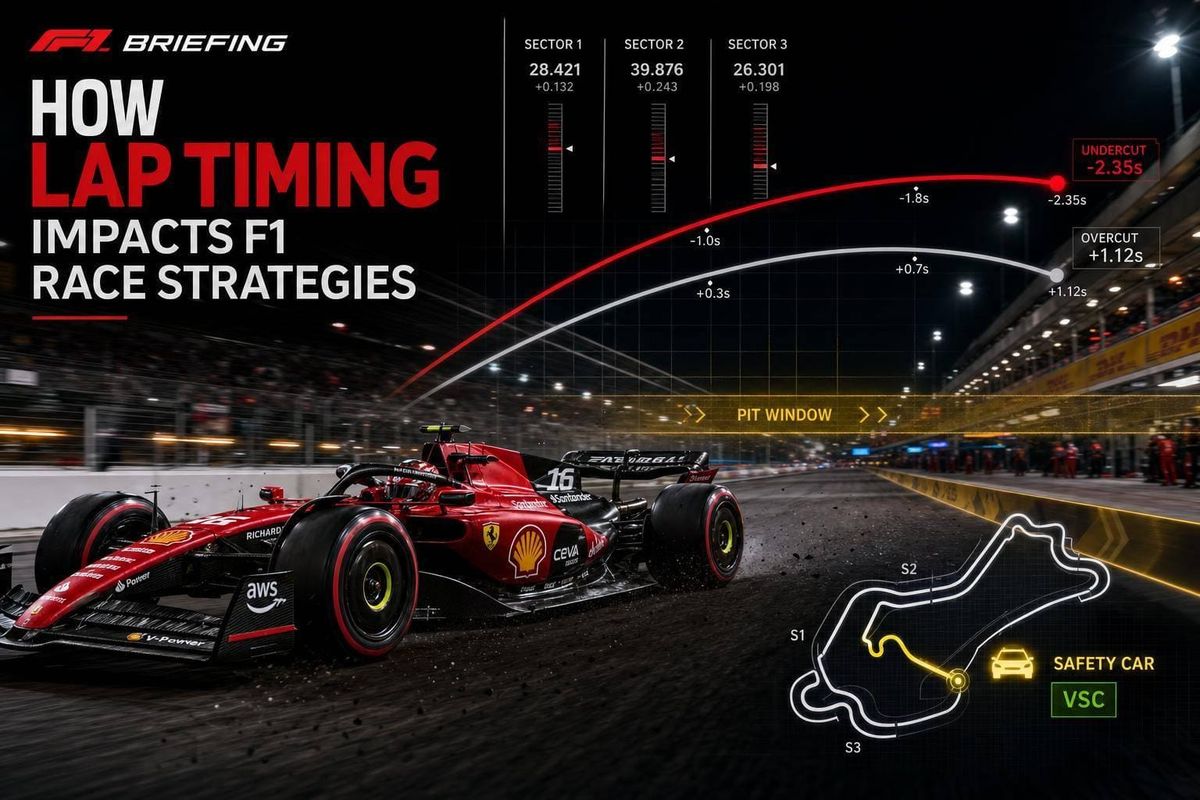
In F1, race calls often come down to a few tenths per lap. If I want to understand why a team pits, waits, or reacts at once, I watch four things: lap time, sector splits, GAP, and INT.
Here’s the short version:
- Lap-time trends matter more than one lap. A car that is 0.1 seconds per lap faster can gain 1.5 seconds over 15 laps.
- Pit windows are built from pace, fuel burn, tire wear, and traffic. In many cases, the live window is about 3 to 5 laps.
- Undercuts work when the tire gain beats pit-loss time. That pit loss is often 20 to 25 seconds under green.
- Overcuts work when the tire warm-up is slow or clean air helps more than new tires.
- Safety Car and VSC can change everything. A VSC stop can cut pit-loss time to about 12 to 14 seconds.
- Teams trust rolling averages, not one-off laps. A 3-lap or 5-lap view gives a better read on tire drop-off.
If I had to boil it down even more, it’s this: teams don’t react to one number - they react to the direction of the numbers. When lap times start drifting, intervals tighten, and tire pace fades, the pit wall changes the plan.
| Signal | What I look for | What it can mean |
|---|---|---|
| Lap time | Pace getting better or worse | Tire life, fuel effect, push phase |
| Sector times | Where time is lost | Traffic, tire issue, setup weakness |
| GAP | Time to the leader | Race picture |
| INT | Time to the next car | Pit-stop threat or chance |
| Out-lap pace | First lap after a stop | Undercut strength |
| Rolling averages | Pace over 3–5 laps | True tire wear trend |
So when I read F1 timing, I’m not just looking at who is fastest. I’m looking at when pace changes, where it changes, and whether that change is big enough to force a pit call.
EVERY F1 STRATEGY EXPLAINED
sbb-itb-7c68254
How teams use lap-time trends to build pit windows
Once teams have a pace baseline, they turn it into a live pit window. In most cases, that window is a 3–5 lap range built from four things working together: base pace, fuel burn-off, tire degradation, and traffic.
Teams begin with long-run data from Friday practice. That gives them fuel-corrected lap times for each compound in race-like conditions. From there, they can estimate how fast the car should be at each point in a stint. But that baseline is just the first layer.
Fuel burn-off gives the car a small pace gain as the race goes on. On many circuits, that’s about 0.03–0.05 seconds per lap as the fuel load drops. Tire degradation pulls the other way. It adds time back in, and how much depends on the compound and the track surface. A medium tire might lose around +0.06 seconds per lap. A soft can drop off at +0.10–0.12 seconds per lap, often with a sharper cliff late in the stint. Put those curves on top of each other, and the model starts to show the point where staying out no longer makes sense.
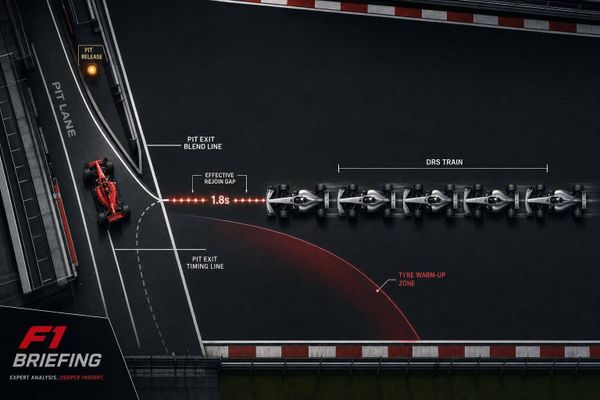
Traffic is the last piece, and it can wreck an otherwise good stop lap. Teams simulate where the car will come out after a pit stop and whether it will rejoin in dirty air or in a slow DRS train. If the car drops into a pack running a second per lap slower, the gain from new tires can disappear fast.
So the best pit window isn’t just the lap with the fastest raw number. It’s the lap that cuts the total cost of wear, traffic, and pit-loss time. Then the race starts, real timing comes in, and that window gets updated lap by lap.
Reading tire degradation through rolling lap averages
Single laps can lie. Traffic, a lockup, or a yellow flag can skew the picture without saying much about the tire itself. That’s why strategists lean on rolling 3-lap and 5-lap averages instead of chasing one lap at a time.
The 3-lap average reacts faster, so it helps spot the first signs that degradation is starting to build. The 5-lap average is steadier and does a better job filtering out short interruptions. When both averages keep running above the pre-race baseline - for example, +0.15–0.20 seconds per lap over five clean laps - teams read that as tire falloff rather than random noise.
One medium-tire stint showed this pretty clearly. Laps 3–8 sat in the best pace zone with an average of 1:26.148. By laps 13–19, the average had slipped to 1:27.38. That’s more than a full second slower per lap.
Adjusting the plan when real pace differs from the model
When live averages don’t match the model, teams rerun the strategy right away.
If degradation shows up earlier than expected - with rolling averages sitting 0.2–0.3 seconds per lap above baseline from lap 10 onward - the software checks whether staying out still works. If the total time lost by extending the stint is more than the pit-stop loss plus the gain from fresh tires, the best stop lap moves earlier. Sometimes it shifts by 3–5 laps.
If the tire is lasting better than modeled, the window moves later instead. In the closing laps of a stint, a lighter car can offset moderate degradation enough to make a longer first stint more appealing. That matters even more if stretching the stint opens up a clean-air rejoin.
Teams usually frame this as a range, like pit between laps 18 and 21 unless degradation spikes. Then they keep updating that range lap by lap as fresh timing data comes in. If degradation comes early, the stop moves forward. If the pace stays stable, the planned window holds. If the tire performs better than expected, the stop gets pushed back. That choice shapes the next play: undercut, overcut, or a reactive stop.
How lap timing drives undercuts, overcuts, and pit reactions
Once the pit window opens, lap timing tells a team what to do next: pit first, stay out, or respond. Rolling averages show whether the window is opening or shutting. After that, it comes down to a simple question: which move is most likely to win track position?
How to calculate when an undercut is available
A pit stop usually costs 20–25 seconds, depending on the circuit. The undercut works when the time gained on fresh tires, plus the rival’s stop delay, is greater than that pit loss.
That sounds simple on paper. On track, traffic can ruin the whole thing.
If the car rejoins into a slow midfield pack, the out-lap loses bite right away. Lap by lap, the tire edge gets chipped away. That’s why teams don’t look at lap time alone. They combine live timing with car-position maps to judge whether the car will come out in clear air or straight into traffic.
At tighter tracks like Monaco or Singapore, that risk is often enough to kill the idea. There just isn’t much room to find clean air. At more open circuits like Austin, the picture changes. A clean out-lap is far easier to get, which makes the undercut far more tempting.
When the overcut or a reactive pit stop is the better option
The overcut makes sense when staying out protects track position longer than fresh tires can pay back the pit loss. This tends to work best when new tires take time to switch on.
In cooler conditions, a rival’s out-lap can be 1.0–1.5 seconds slower than steady race pace. If tire wear is only adding 0.2–0.5 seconds per lap and the current set is still in its stable range, staying out in clean air can be worth more than diving in.
A reactive stop is the defensive version of the same math. The second a rival pits, strategists run the numbers again. If that rival’s fresh tires are likely to gain enough time per lap to jump ahead before the planned stop, the message is simple: box next lap.
The first clue comes from the rival’s out-lap sectors. Purple sectors are a warning sign. They show the tire edge is live, and that the threat is no longer theoretical. In that case, reacting on the very next lap is often the safer move. That same timing read becomes even more important once tire pace starts to drop fast.
How timing data shapes tire management and Safety Car decisions
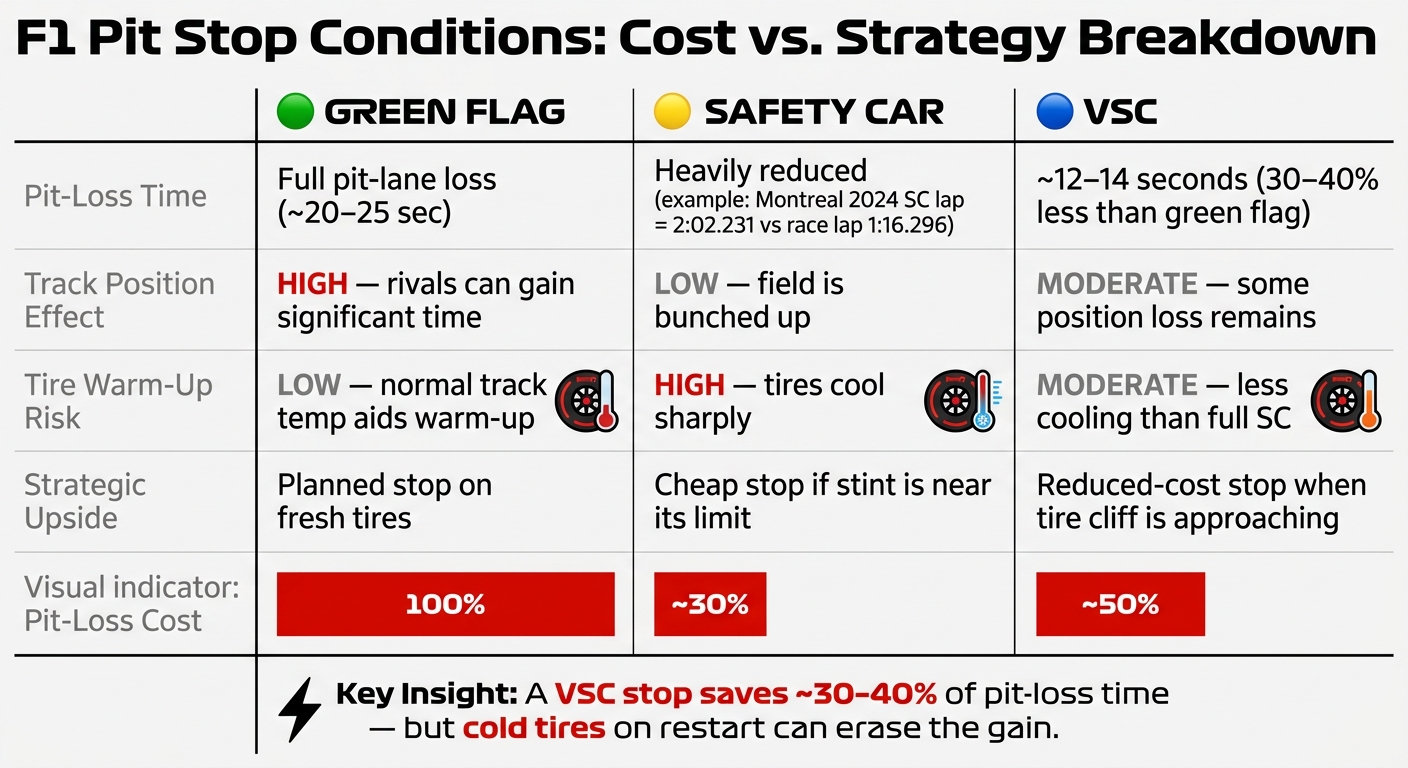
F1 Pit Stop Strategy: Green Flag vs Safety Car vs VSC Timing
Spotting the tire performance cliff from lap-by-lap data
After teams map out the pit window, the next step is figuring out when tire performance stops fading in a normal way and starts falling off a cliff. In most stints, lap times drift upward bit by bit. A cliff is different. It’s the moment that drift gets much steeper and doesn’t bounce back.
That’s why one bad lap usually isn’t enough to trigger a stop. It could be traffic. It could be a small driver error. Sector splits help sort that out. If the slowdown shows up in just one sector, it often points to a local tire issue, like graining or overheating, rather than full drop-off across the whole lap.
Track temperature matters too. On hotter surfaces, softer compounds can lose pace faster, so teams watch for a steeper degradation trend across several clean laps. When that slope starts climbing and keeps climbing, that’s often the sign to box soon.
Using Safety Car and VSC timing to cut pit-loss time
Once the cliff starts to show, the next call is simple in theory and tough in practice: stop now, or wait for race control to make the stop cheaper.
Under green-flag running, a pit stop costs the full pit-lane loss. Under a Safety Car or Virtual Safety Car, that loss shrinks because the whole field is circulating at a much lower speed. You can see the gap clearly in Montreal. Lewis Hamilton's Safety Car lap in 2024 was 2:02.231, compared with a 1:16.296 race lap. That difference shows just how much time gets compressed when the race is neutralized.
A VSC stop typically costs around 12–14 seconds, or about 30–40% less than a stop under green-flag conditions. That can change the whole shape of a race.
| Condition | Typical pit-loss (seconds) | Track-position effect | Tire warm-up risk | Strategic upside |
|---|---|---|---|---|
| Green flag | Full pit-lane loss | High - rivals can gain significant time | Low - normal track temperature helps warm-up | Planned stop on fresh tires |
| Safety Car | Heavily reduced | Low - the field is bunched up | High - tires cool sharply | Cheap stop if the stint is already near its limit |
| VSC | Around 12–14 | Moderate - some position loss remains | Moderate - less cooling than a full Safety Car | Reduced-cost stop when the cliff is approaching |
The catch is the restart. A cheap stop only pays off if the car can switch the new tires on fast enough. Fresh rubber is great, but cold tires after a Safety Car can bite back. So teams weigh two things at once: the live degradation trend and the value of track position. If the tire drop-off is already running worse than the model expected, the lower-cost stop often makes sense. If not, staying out and keeping position can be the better play.
That’s where lap-time data stops being just information and starts shaping the race in real time.
Conclusion: How to read lap timing as a strategy tool
Every strategy call in this article comes back to one thing: how lap times shift over a stint. Pit windows, tire-life calls, undercut moves, overcut attempts, and Safety Car reactions all come from the same place. It’s not about one lap in isolation. It’s about how pace changes across several laps.
Key signals to watch during live race analysis
When you’re reading strategy live, look at these signals together, not one by one.
- Rolling pace trends - best judged over 3 to 5 clean laps - show whether a car is steady, dropping off, or wearing its tires faster than expected.
- Gap versus interval matters. Gap shows distance to the race leader. Interval is the more direct pit-window clue.
- Out-lap pace on fresh tires shows whether a pit stop will win or lose track position.
- Degradation rate shows how close a tire is to the point where pace falls away.
- Reduced pit loss under a Safety Car or VSC shows when a stop becomes cheap enough to change the whole plan.
When those signals start moving in the same direction, the pit wall is usually already reacting. Read the timing screen this way, and strategy starts to show up before the radio call.
FAQs
How do teams separate tire wear from traffic effects?
Teams use real-time telemetry and fuel-corrected lap-time analysis to tell the difference between tire wear and traffic effects. By adjusting for the 0.03-second lap-time change per kilogram of fuel burned, engineers get a cleaner view of the actual tire degradation rate.
They then compare that data with GPS tracking and sector times to see whether a driver slowed because the tires were fading or because of traffic.
Why can a faster car stay out instead of pitting first?
A faster car may stay out longer and try an overcut strategy. This tends to work best on tracks with low tire wear, where the driver can still put in strong lap times on older tires.
By waiting longer to pit, the driver hopes to get clear air once others stop and maybe take advantage of shifts in race conditions. It all comes down to keeping up the pace, looking after the tires, and reading how the race is likely to unfold.
How much does a VSC change the ideal pit lap?
A Virtual Safety Car (VSC) can change the ideal pit lap in a big way because it cuts the time lost during a pit stop compared with normal green-flag running.
When the field is neutralized, teams weigh that lower pit-loss cost against tire life and track position. Then they use real-time telemetry and predictive simulations to decide if a VSC stop makes sense.