7 Wireless Sensors Behind F1 Live Telemetry
Seven sensor groups collect and stream F1 car data, separating direct measurements from model estimates to guide pit-wall decisions in real time.
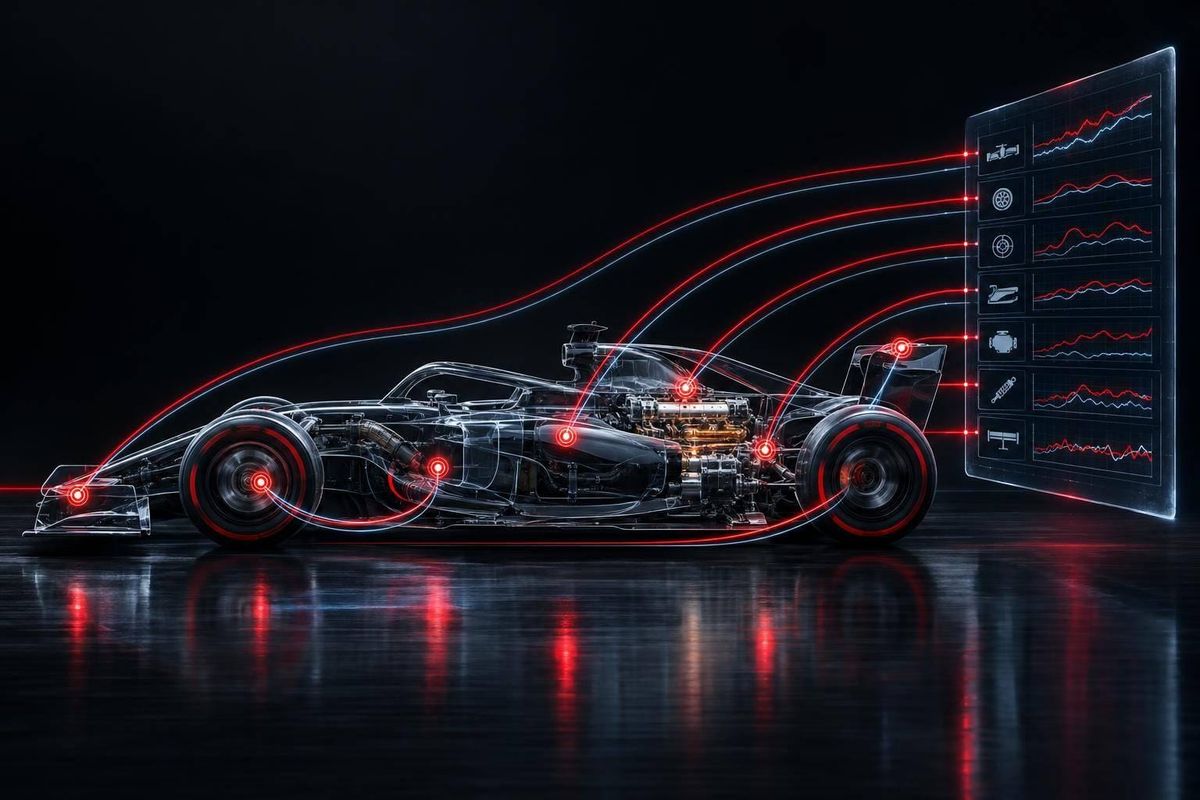
F1’s wireless telemetry link sends about 30 MB of live data per lap - not from seven wireless sensors, but from seven sensor groups that are mostly wired into the car. I separate what those sensors measure from what engineers estimate, so you can tell a pressure warning from a tire-life forecast.
Here’s what each group helps teams track:
- Tire: Temperature and pressure guide tire management and pit timing.
- Brake: Heat and hydraulic pressure help flag braking problems.
- Engine and power unit: Speed, temperature, pressure, and electrical readings help monitor reliability.
- Suspension and vehicle dynamics: Travel, wheel speed, motion, and loads help assess grip and handling.
- Aerodynamic pressure and flow: Air readings help teams estimate downforce and check airflow.
- Fuel flow and energy use: Consumption and electrical readings support fuel-saving and deployment plans.
- Driver input: Steering, throttle, braking, and shift signals show how the driver’s actions relate to the car’s response.
The distinction I keep in view: <u>measurements are not predictions</u>. Teams stream selected channels to the pit wall and keep other data onboard for later review, within FIA rules. Engineers use those readings to advise the driver - not to control the car remotely.
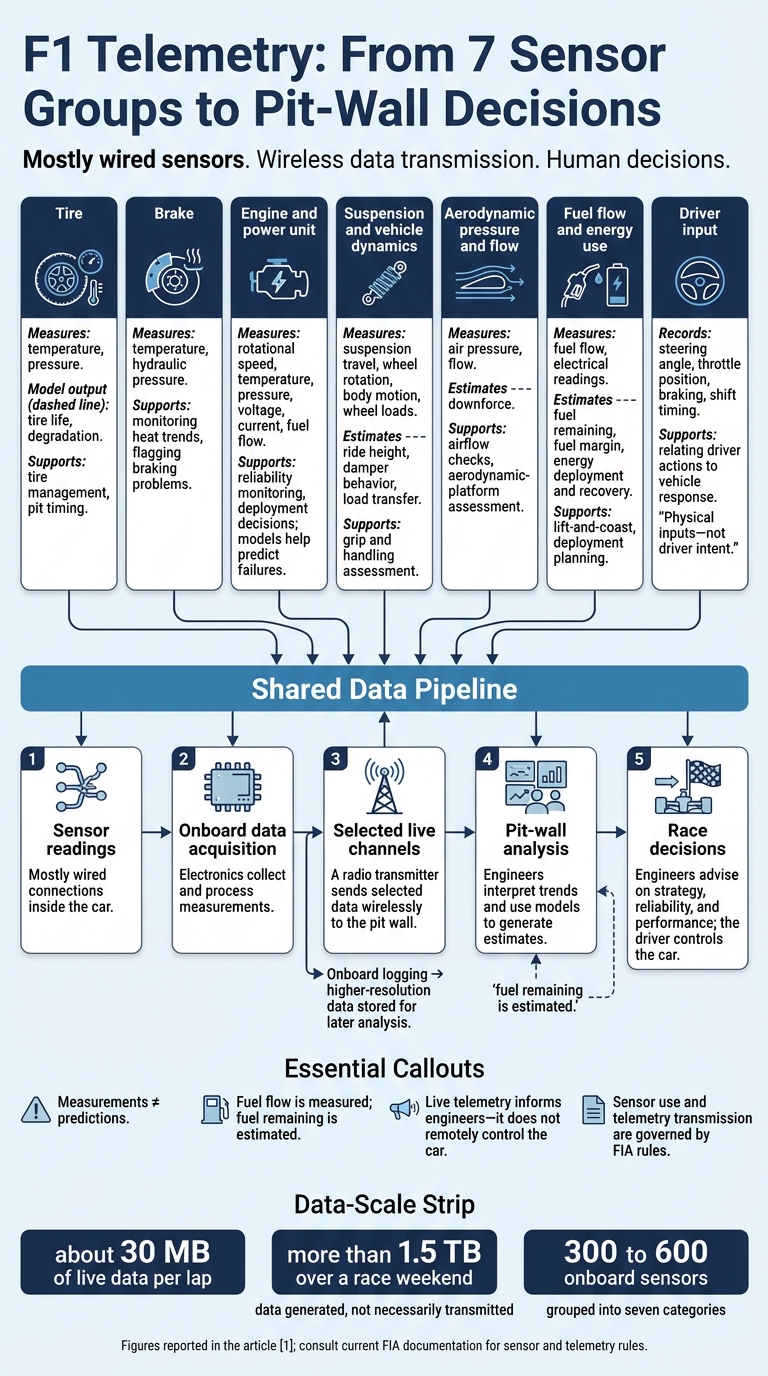
F1 Telemetry: From 7 Sensor Groups to Pit-Wall Decisions
How F1 Cars Collect Data in Real Time
sbb-itb-7c68254
What Wireless Telemetry Means in F1
Telemetry is the live data stream from the car to the pit wall. The sensors themselves are usually wired into the car’s onboard electronics - not connected wirelessly.
Across seven sensor groups - tire, brake, power unit, suspension, aero, fuel, and driver input - measurements flow into onboard data acquisition electronics. Those electronics collect the data, then pass only the channels teams choose to stream live through a radio transmitter to the pit wall. This path matters because FIA rules govern both sensor use and telemetry transmission.
Live telemetry helps engineers make decisions during a session; onboard logging stores higher-resolution data for later analysis. Engineers use those logs afterward to refine the car’s setup, race strategy, and reliability models.
As you read about the sensor categories that follow, separate measurements from estimates. Measured values come directly from sensors. Estimates, such as tire degradation or overtaking probability, come from models built using those inputs. The next section explains the regulatory limits that determine what teams can monitor live and what data stays on the car for later analysis.
2026 FIA Sensor and Telemetry Rules
FIA rules govern which sensor measurements teams can stream live, which must stay onboard, and which channels are reserved for FIA systems. The next sections explain how each of the seven sensor groups guides live decisions within confirmed rule limits.
1. Tire Temperature and Pressure Sensors
Measured Signals and Estimates
Tire sensors directly measure surface temperature and internal pressure. Models then use those readings to estimate tire life and degradation. That matters because tire heat changes faster than wear can be measured directly.
Engineering Uses
Teams track live temperatures to spot overheating before grip drops. A single reading shows condition, not direction. Readings over time show how fast tires warm up and whether they risk overheating.
Prediction models estimate degradation and stint length using track temperature, asphalt, driving style, fuel load, and tire compound characteristics.
Data Path to the Pit Wall
Live tire telemetry lets pit-wall engineers compare heat trends with stint targets and pit-window forecasts. Those comparisons help teams guide the driver and decide whether to pit earlier. The same approach applies to brakes, where heat spikes can develop even faster.
2. Brake Temperature and Pressure Sensors
Measured Signals and Estimates
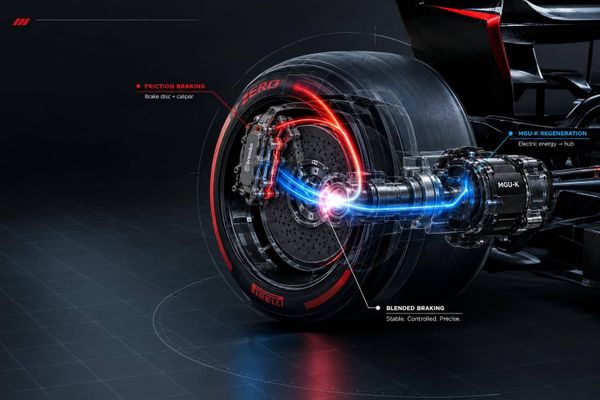
Brake sensors measure temperature and hydraulic pressure in the braking circuit. Brake pressure is a primary live metric, giving engineers real-time data on braking-system performance.
Engineering Uses
As with tire data, brake readings matter most as a trend - not in isolation. Engineers track heat and pressure in real time to spot brake fade, lockup risk, and sensor faults before they affect braking performance.
Data Path to the Pit Wall
Brake data travels through the live telemetry stream to the pit wall. There, engineers compare temperature and pressure trends with braking balance, fade, and corner-entry stability. The same approach applies to the power unit, where temperature and pressure trends guide reliability and deployment decisions.
3. Engine and Power-Unit Sensors
Measured Signals and Engineering Uses
Power-unit telemetry moves live monitoring beyond heat management to reliability and deployment. Sensors measure rotational speed, temperature, pressure, voltage, current, and fuel flow. Engineers and models use these readings to spot unusual behavior and predict failures.
Data Path to the Pit Wall
Like the tire and brake channels covered earlier, these signals travel from wired sensors through onboard electronics. The electronics then stream selected channels to the pit wall. Team channels help guide performance and reliability decisions, while FIA fuel-flow channels support compliance.
Suspension and vehicle-dynamics data follow the same pattern, feeding live decisions.
4. Suspension and Vehicle-Dynamics Sensors
Measured Signals and Estimates
Power-unit sensors track reliability. Suspension sensors track how the car uses the track surface. Suspension-position sensors, wheel-speed sensors, accelerometers, and load sensors measure suspension travel, wheel rotation, body motion, and wheel loads. Teams combine these signals to estimate ride height, damper behavior, and load transfer, helping them assess grip and platform control in real time.
Engineering Uses
Engineers compare wheel-speed readings with the combined vehicle-dynamics data to assess traction. Suspension travel and acceleration help them tell a curb strike from possible bottoming.
Ride-height estimates guide aerodynamic-platform setup, along with spring and damper choices. The same data shows whether the chassis is stable enough to keep the aero platform within its target window.
Data Path to the Pit Wall
At the pit wall, synchronized traces help teams tell whether a change came from a brief curb strike or a sustained load change.
5. Aerodynamic Pressure and Flow Sensors
Measured Signals and Estimates
Once suspension data confirms the car is in its platform window, aero sensors show whether it’s producing the expected downforce. These sensors measure how air moves over the car. Teams pair those readings with ride-height data to check whether the floor and wings are in their target window.
Sensors around the nose, floor, wings, and bodywork track pressure changes where airflow is most sensitive.
Engineering Uses
Engineers compare live aero traces with CFD and wind-tunnel baselines to spot lost downforce, airflow separation, or faulty readings.
Data Path to the Pit Wall
The pit wall checks the live stream to confirm that an aero anomaly is real before changing setup or strategy. This check helps teams avoid reacting to a false aero signal.
6. Fuel Flow and Energy-Use Sensors
Measured Signals and Estimates
Fuel and energy sensors help the pit wall turn consumption data into race plans. Fuel flow is measured; fuel remaining is estimated. Readings from the onboard fuel and hybrid systems help teams estimate how much fuel is left and how much they need to reach the checkered flag.
Energy-use data work the same way: raw readings support estimates of energy deployment and recovery. The driver’s throttle and braking inputs shape those figures, as the next section explains.
Engineering Uses
Engineers use these signals to track fuel margin - the gap between estimated fuel remaining and the amount needed to finish the race. Consumption and recovery models help them plan lift-and-coast, energy recovery, and targeted deployment.
Data Path to the Pit Wall
Fuel and energy channels pass through onboard electronics into the live telemetry stream sent to the pit wall. These data support both FIA checks and race planning. Engineers use the readings to refine fuel-margin estimates and adjust deployment and lift-and-coast decisions based on driver inputs.
7. Driver-Input Sensors
Measured Signals and Estimates
The driver provides the final live channel, completing the telemetry picture. Driver-input channels record steering angle, throttle position, and gearshift timing. These signals show physical control inputs - not the driver’s intent.
Data Path to the Pit Wall
Onboard sensors record these signals and send them through onboard electronics into the live telemetry stream. Engineers then compare the commanded shift with the gearbox’s actual response.
Engineering Uses
Engineers match driver inputs with wheel-speed, tire-temperature, and aero-load traces. Comparing steering and shift traces against wheel-speed and aero-load data helps them spot traction loss or shift errors.
Together with the other six sensor groups, driver inputs help engineers turn raw readings into pit-wall decisions.
From Sensor Readings to Pit-Wall Decisions
The pit wall has to turn data from these seven sensor groups into a single stream of live decisions. A modern F1 car transmits about 30 MB per lap and generates more than 1.5 TB over a race weekend.
Real-time machine learning processes readings from 300 to 600 onboard sensors to help guide live calls. It spots patterns tied to tire degradation and pit strategy before engineers review the data.
The processing links tire, brake, power-unit, and vehicle-dynamics channels, letting engineers assess related changes together - and turn raw readings into setup, strategy, and reliability decisions.
Comparing the 7 Sensor Categories
The table separates direct sensor readings from model-based outputs and shows how each category helps the pit wall make decisions.
| Sensor category | Principal measurement | Typical installation area | Pit-wall decision | Direct signal versus modeled output | Typical urgency | Main failure or interpretation risk |
|---|---|---|---|---|---|---|
| Tire | Surface/carcass temperature and pressure | Wheel rims and uprights | Pit stop timing; tire management instructions | Direct temperature and pressure readings; modeled degradation | High for pressure loss; trend-based for wear | Surface and carcass temperatures can differ; heat soak |
| Brake | Disc temperature and hydraulic pressure | Brake ducts and calipers | Brake-bias adjustment; cooling flap settings | Direct signal | Critical for safety or failure | Heat soak, sensor damage, or pressure noise |
| Engine / power unit | RPM, oil and water temperatures, ERS energy | Engine bay and power unit | Engine mode changes; retirement decisions | Direct signal | High for reliability | Vibration-induced signal loss; sensor drift |
| Suspension | Load, travel, and g-force | Dampers and wishbones | Ride-height adjustment; mechanical balance | Direct signal | Medium for performance | Bottoming out can mask true load readings |
| Aerodynamic | Air pressure and flow velocity | Front wing, floor, airbox (Pitot tubes) | Wing angle changes; aero balance | Indirect: pressure and flow readings become downforce estimates | Trend-based | Turbulence and dirty air interference |
| Fuel | Flow rate and fuel remaining | Fuel tank and fuel lines | Lift and coast; fuel mapping | Direct signal; FIA-controlled channel | High for compliance or risk of running out | Ultrasonic calibration errors |
| Driver input | Steering angle, throttle, brake position | Steering wheel and pedals | Driver coaching; identifying driving errors | Direct signal | Low during the race; useful after the lap | Driver style can mimic handling problems |
Context sets the urgency. Sudden pressure loss calls for immediate action, while wear and fuel forecasts rely on trends across multiple laps.
Conclusion: Turning Measurements Into Decisions
The seven sensor categories link measurement to decision. Onboard electronics process signals, while wireless telemetry sends selected data to the pit wall. Engineers use that data to manage reliability, performance, and strategy. A measurement is evidence. A prediction is a model output - not a guarantee of tire life or pit timing.
Live telemetry helps guide decisions, but the driver still controls the car.
Consult the current FIA documentation for rules on sensors and telemetry. Read telemetry as a chain: sensor reading, onboard processing, pit-wall analysis, and race decision. When assessing a claim, separate the measured value, model output, and decision.
FAQs
What happens if an F1 car loses telemetry?
When an F1 car loses its live telemetry feed, the pit wall can no longer track tire degradation, engine pressures, or fuel flow in real time. That makes race decisions harder. Engineers must rely on driver feedback and observation to assess the car’s condition against safety thresholds [2].
Teams use physical pit boards to relay key information to the driver, including positions, time gaps, and pit instructions.
How do teams distinguish sensor faults from car problems?
Teams compare real-time telemetry with historical baselines, digital twin simulations, and machine learning models to spot unusual readings [2][3]. When a reading falls outside expected limits, engineers check data across systems to determine whether it points to a mechanical problem or a sensor error [2][5]. AI-driven normalization helps filter out noise from surrounding conditions and check that sensors are working correctly [3][4].
Which telemetry-based adjustments are legal during a race?
In Formula One, telemetry works in one direction: the car sends data to engineers, but engineers cannot send commands back. Teams cannot remotely adjust the car’s systems while it’s on track.
The driver must change engine modes, differential settings, or brake balance manually using the steering wheel controls. Those adjustments follow team radio guidance or the driver’s own observations from the cockpit.