Fracture Toughness Tests for F1 Composite Panels
Fracture toughness testing reveals whether F1 carbon panels stop cracks or let them spread — shaping design, repair and material choices.
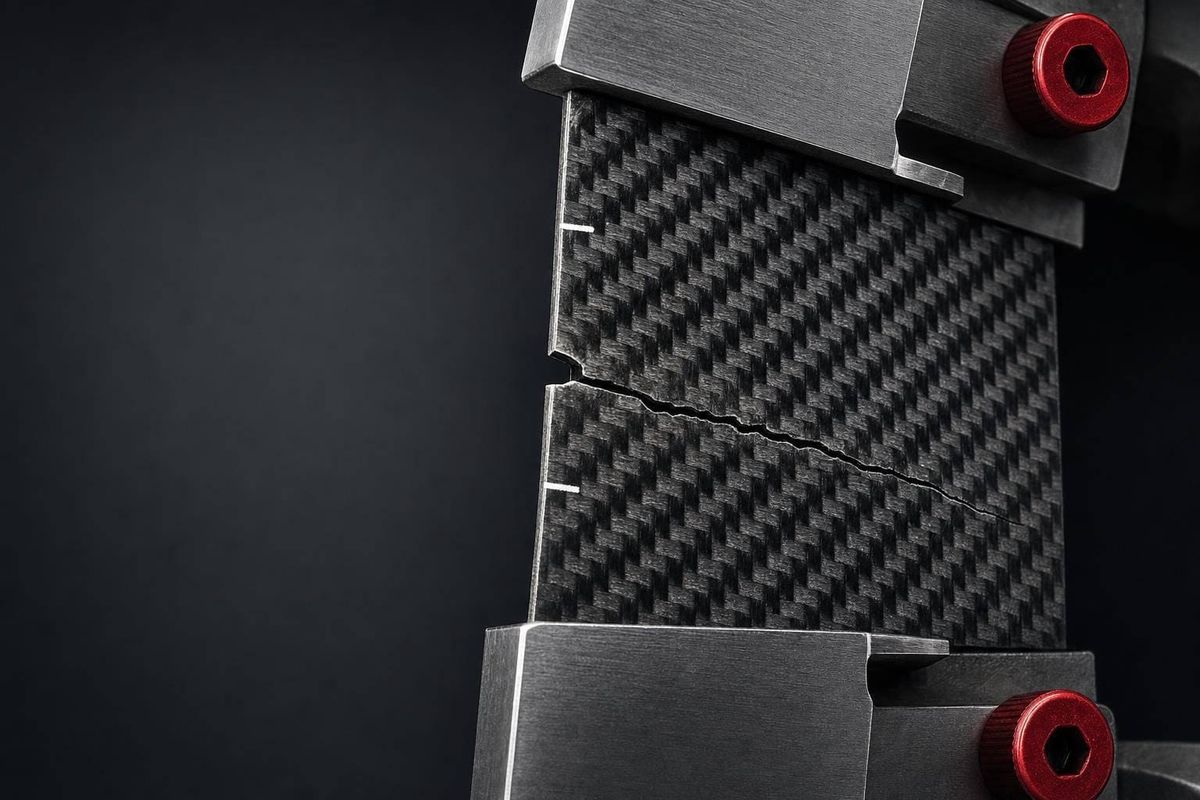
A carbon panel can pass a strength check and still fail once a crack starts. That’s why F1 teams test fracture toughness before they trust a monocoque, floor, or crash part.
If I strip this down to the core idea, here’s what the article says:
- Strength shows the max load before break.
- Stiffness shows how much a panel bends.
- Fracture toughness shows whether a crack stays small or spreads through the laminate.
- Teams mainly track Mode I, Mode II, and mixed-mode crack growth.
- Common lab tests include DCB for Mode I and ENF for Mode II.
- Engineers turn load, displacement, and crack-length data into G values such as G<sub>Ic</sub> and G<sub>IIc</sub>.
- Those values guide decisions on ply count, stacking sequence, resin choice, interleaves, and repair or replacement limits.
A few numbers stand out. The article notes that some toughened laminates have shown about 294% higher Mode I toughness and 51% higher Mode II toughness than baseline CFRP systems. It also notes that, in some toughened laminates, Mode II propagation toughness can be about 1.7× the initiation value. That gap matters when engineers judge damage after curb strikes, debris hits, or crash loads.
Here’s the short version: good fracture data is not just a lab exercise. It helps a team decide if a panel is safe to run, needs local reinforcement, or should be scrapped.
| Topic | What I’d keep in mind |
|---|---|
| What teams measure | Crack growth resistance after damage starts |
| Main test modes | Mode I opening and Mode II sliding |
| Main standards | ASTM D5528 for DCB, ASTM D7905 for ENF |
| Main outputs | G<sub>Ic</sub>, G<sub>IIc</sub>, and crack-growth behavior |
| Common failure signs | Fiber bridging, matrix cracking, debonding, shear hackles |
| Design use | Monocoques, floors, crash structures, inspection limits |
| Material trade-offs | Tougher resin and interleaves can improve damage resistance, but often add mass and process steps |
So if you want the plain-English takeaway, it’s this: fracture toughness testing tells an F1 team how damage is likely to grow, not just when a panel first breaks.
ASTM D5528 Standard Test Method for Mode I Interlaminar Fracture Toughness
sbb-itb-7c68254
Specimen Preparation: Laminate Layup, Starter Cracks, and Test Conditioning
Fracture toughness data starts with coupons that match the target laminate, cure cycle, and fiber orientation. Put simply, the coupon needs to mirror the target part before any crack-growth test begins.
Teams usually machine coupons from production-representative panels. Then they add a controlled starter crack or notch before testing. After that, they keep tight control over notch geometry and pre-crack length so the starting damage is repeatable.
Test Setup: Loading Methods and Data Collection
Once the starter crack is in place, the rig applies controlled loads and tracks how the crack grows. The aim is simple: get stable crack growth before the specimen breaks.
Quasi-Static and Higher-Rate Loading
For standard material qualification, teams usually use quasi-static loading because it gives a steady way to check residual strength and sub-critical crack growth. Higher-rate loading comes into play for cases like debris strikes or crash events, where fracture behavior can change compared with a slow-loading test.
Measuring Load, Displacement, and Crack Length
During the test, teams record load, displacement, and crack mouth opening displacement (CMOD). CMOD can be measured directly or worked out from deflection. Together, these readings shape the load-displacement curve used to calculate fracture toughness.
But those numbers are only useful if crack length is tracked just as carefully. High-resolution cameras follow crack-tip motion against reference marks. Ultrasound and other NDT methods map internal delamination that can't be seen at the surface. That level of precision matters because the rate-dependent response of composites means even small displacement errors can skew the toughness result.
Reading the Results: Data Reduction and Failure Modes
ASTM Data Reduction for DCB and ENF Tests
Once the load and crack-growth data are in hand, the job shifts from testing to math. Teams take load, displacement, and crack-length data and turn them into G values that describe how a crack grows through the laminate. In DCB work, that often means building an R-curve so engineers can separate crack initiation from crack propagation.
For Mode I DCB tests, ASTM D5528 recognizes three main reduction methods: Modified Beam Theory (MBT), Compliance Calibration (CC), and Modified Compliance Calibration (MCC). MBT uses an effective crack-length correction, (a + \Delta), to account for root rotation at the crack tip. The main equation is (G_I = 3P\delta / 2b(a+\Delta)), where (P) is load, (\delta) is displacement, (b) is specimen width, and (a) is crack length.
For Mode II ENF tests, ASTM D7905 uses Compliance Calibration. Engineers plot compliance against (a^3), fit the calibration curve, and then combine that result with the maximum load to calculate (G_{IIc}). Because ENF delamination is often unstable, teams usually report initiation toughness only. In toughened laminates, propagation toughness can be about 1.7× higher than initiation toughness.
Common Failure Modes in Composite Panels
The fracture surface tells you whether the crack failed the way it was supposed to. That check matters. A number on its own can look fine, but the surface often shows what the test was actually doing.
Under Mode I opening, engineers often see fiber bridging, fiber–matrix debonding, and matrix cracking. Bridging fibers soak up extra energy, which sounds good, but there's a catch: they can make the calculated toughness look higher if the reduction method doesn't account for them.
Under Mode II shear, the surface is usually marked by matrix cracking, interface debonding, and inclined shear hackles, while fiber breakage is rarely seen. When toughened interleaves or hybrid interfaces are in the stack, cracks can deflect and bridge across those layers. That leaves banded fracture surfaces, a sign that the crack had to work through a tougher path. Those marks help engineers sort out whether the weak spot is the resin, the bond, or the interlaminar interface.
Comparing Data Methods and Failure Signs
| Method | Test Standard | Key Input Needed | Typical Fracture Evidence |
|---|---|---|---|
| Modified Beam Theory (MBT) | ASTM D5528 (Mode I) | Load, displacement, crack length, compliance–length calibration | Fiber bridging, matrix cracking, fiber–matrix debonding |
| Compliance Calibration (CC) | ASTM D5528 / D7905 | Multiple compliance vs. crack-length data points | Mode I bridging; Mode II shear hackles and micro-cracks |
| Modified Compliance Calibration (MCC) | ASTM D5528 (Mode I) | Cube-root compliance fit using normalized crack length | Similar fracture evidence to MBT |
MBT is straightforward, but it depends on accurate crack-length measurement. If bridging is heavy or crack growth turns unstable, teams may check the ASTM result against FE-based J-integral work. Those values then feed into part-level trade-offs for monocoques, floors, and crash structures.
Using Lab Results to Guide Car-Part Decisions
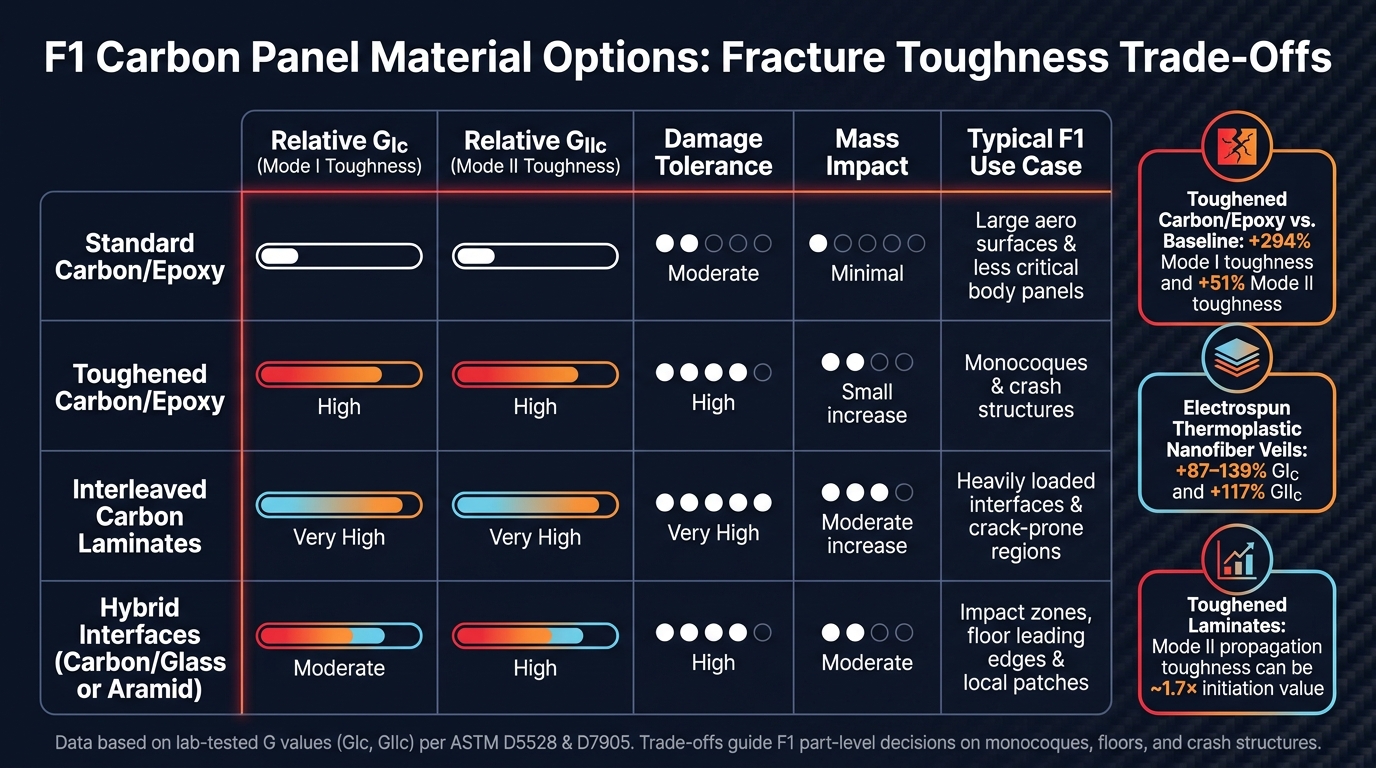
F1 Carbon Panel Material Options: Fracture Toughness Trade-Offs
Once DCB and ENF data are reduced to G values, the focus moves from testing to design.
How Toughness Data Guides Monocoques, Floors, and Crash Structures
Teams use measured G_Ic and G_IIc values as design allowables for monocoques, floors, crash structures, and bodywork. In plain English, those numbers help decide local ply counts, stack orientation, and resin selection before a part ever reaches the car.
For the monocoque, Mode I toughness matters most around cockpit cut-outs, harness mounts, suspension pickups, and halo cut-outs. These are the areas where through-thickness crack growth can put driver safety at risk. If DCB testing shows weak G_Ic at a key interface, engineers may add plies, switch to a local 0/±45/90° stack, or call for a tougher resin in that zone to slow delamination.
For the floor, the story changes. Mode II tends to drive damage in areas that take curb strikes and sliding impacts, so G_IIc helps set ply count and interleave placement around the plank and leading edges. Crash structures need both values at once. Engineers feed G_Ic and G_IIc into crash models to check that cracks form and grow in a controlled, progressive way that absorbs energy instead of turning into sudden delamination.
Teams also use DCB- and ENF-derived crack-growth behavior to set inspection limits during a race weekend. Engineers estimate how fast an impact-started delamination could spread under race load cycles, then turn that into accept/reject rules for visual checks and NDT inspections. A floor-edge chip that stays below the tested G_IIc threshold might be cleared to run. A monocoque delamination near a weak interface will usually trigger replacement.
When measured toughness comes in below target, the next move is simple in theory but tricky in practice: find the lightest fix that still gets the job done.
Material Trade-Offs: Toughened Resins, Interleaves, and Hybrid Interfaces
Every toughening method comes with a trade-off. More fracture resistance usually means more mass, more manufacturing steps, or both.
Toughened epoxy resins can increase G_Ic and G_IIc by a large margin. Studies have reported a 294% increase in Mode I toughness and a 51% increase in Mode II toughness for a toughened-film laminate versus standard CFRP baselines. The catch is that they add mass and can make cure cycles harder to manage.
Electrospun thermoplastic nanofiber veils can push both values even higher, with reported gains of +87–139% in G_Ic and +117% in G_IIc. But that comes with extra manufacturing steps and a small increase in thickness.
The table below shows how common material options compare across the factors F1 engineers weigh in practice:
| Material Option | Relative G_Ic | Relative G_IIc | Damage Tolerance | Mass Impact | Typical Use Case |
|---|---|---|---|---|---|
| Standard carbon/epoxy | Baseline | Baseline | Moderate | Minimal | Large aero surfaces, less critical body panels |
| Toughened carbon/epoxy | High | High | High | Small increase | Monocoques, crash structures |
| Interleaved carbon laminates | Very high | Very high | Very high | Moderate increase | Heavily loaded interfaces, crack-prone regions |
| Hybrid interfaces (carbon/glass or aramid) | Moderate | High | High | Moderate | Impact zones, floor leading edges, local patches |
There isn't one fix for every part. Toughened resins make sense in safety-critical structures where a few hundred grams of extra mass is acceptable. Interleaves are usually kept for specific interfaces where toughness testing has flagged a clear risk. Hybrid plies that mix carbon with glass or aramid are used in local impact zones where Mode II resistance matters most and where the stiffness penalty stays under control.
Conclusion: What Fracture Toughness Testing Tells an F1 Team
The same fracture data that set allowables also help show how a part is likely to fail - whether the problem is resin-driven, interface-driven, or more damage-tolerant.
Fracture toughness tests tell engineers whether a panel should be cleared, reinforced in one area, or rejected. Representative specimens matter a lot here. Tests on unidirectional coupons can overpredict or underpredict performance in the woven and multi-directional laminates that make up an actual race car. Notch geometry and loading control decide whether the test result is valid. And data reduction methods such as MBT, CC, or MCC can change the reported G value, which then changes the design allowable. That's why teams need consistency with ASTM D5528-style procedures.
The failure mode matters just as much as the number. A clean interfacial debond usually points to a manufacturing or surface-preparation issue that needs attention before the part goes on track. Cohesive fracture through the resin suggests the matrix is the limiting factor and may push engineers toward a resin change. Fiber pull-out and mixed-mode fracture surfaces point to a structure that can absorb energy through more complex damage mechanisms. Put together, the G values and the fracture surface give engineers the basis to clear, reinforce, or reject the part.
FAQs
Why isn’t strength testing alone enough for carbon panels?
Strength testing on its own doesn’t tell the full story for carbon fiber composite panels. These materials are very sensitive to flaws and damage. A strength test shows the maximum load a panel can take before it fails, but it doesn’t show how that same panel will act if it already has a crack or a tiny defect.
That’s where fracture toughness testing comes in. It measures how well a panel resists crack growth. In plain English, it helps show whether the panel can stay structurally sound even when there’s minor delamination or small damage under high-stress racing conditions.
How do DCB and ENF tests relate to real F1 car damage?
DCB and ENF tests measure the interlaminar fracture toughness of composite panels. Put simply, they show how much energy a crack needs to keep growing between the layers of a laminate. That matters when teams want to model how parts like the monocoque or aerodynamic panels might delaminate under heavy track loads.
Teams use this data to check structural integrity, predict how parts may behave during impacts, and validate finite element models - without giving up the low weight that makes composites so useful in racing.
What makes a panel repairable versus scrap?
A composite panel is classed as repairable or scrap based on non-destructive testing and the job that part does on the car. Teams keep a record of each component’s service life, then check for damage with visual inspections and stiffness tests.
Damage to non-structural parts is more likely to be fixed. Critical structural parts, like the monocoque, go through a much stricter review. A part is marked as scrap if its structural integrity can’t be fully restored, or if a repair would hurt safety, aerodynamics, or performance.