Pit Timing in F1: Ultimate Data Guide
Price total pit loss, track tire degradation, map rejoin gaps, and use SC/VSC math to choose the optimal lap to pit.
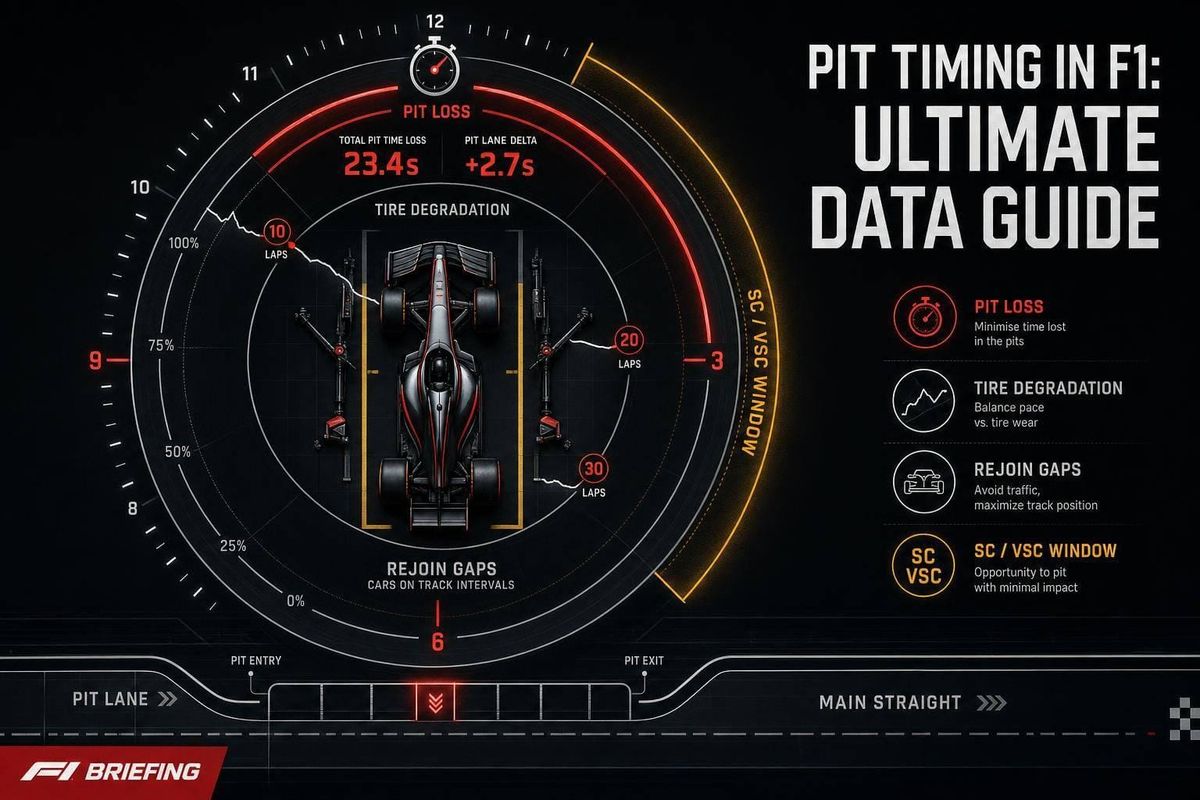
In F1, the pit stop is short. The pit call is what changes the race. I’d sum it up like this: teams pit when the time lost in the lane - often 18–25 seconds under green - gets paid back by better lap times, cleaner air, or a lower-cost stop under a Safety Car or VSC.
Here’s the simple version of the whole article:
- I look at pit loss as a full number, not just the tire change: in-lap + pit lane transit + stationary time + out-lap
- I track tire wear by stint, including the point where lap times start falling away hard
- I compare undercut vs. overcut based on lap-time swing, warm-up loss, and traffic
- I check rejoin gaps to avoid DRS trains and slower cars
- I treat Safety Car and VSC periods as a full reset, because they can cut the cost of a stop by around 10+ seconds
A few numbers matter most right away:
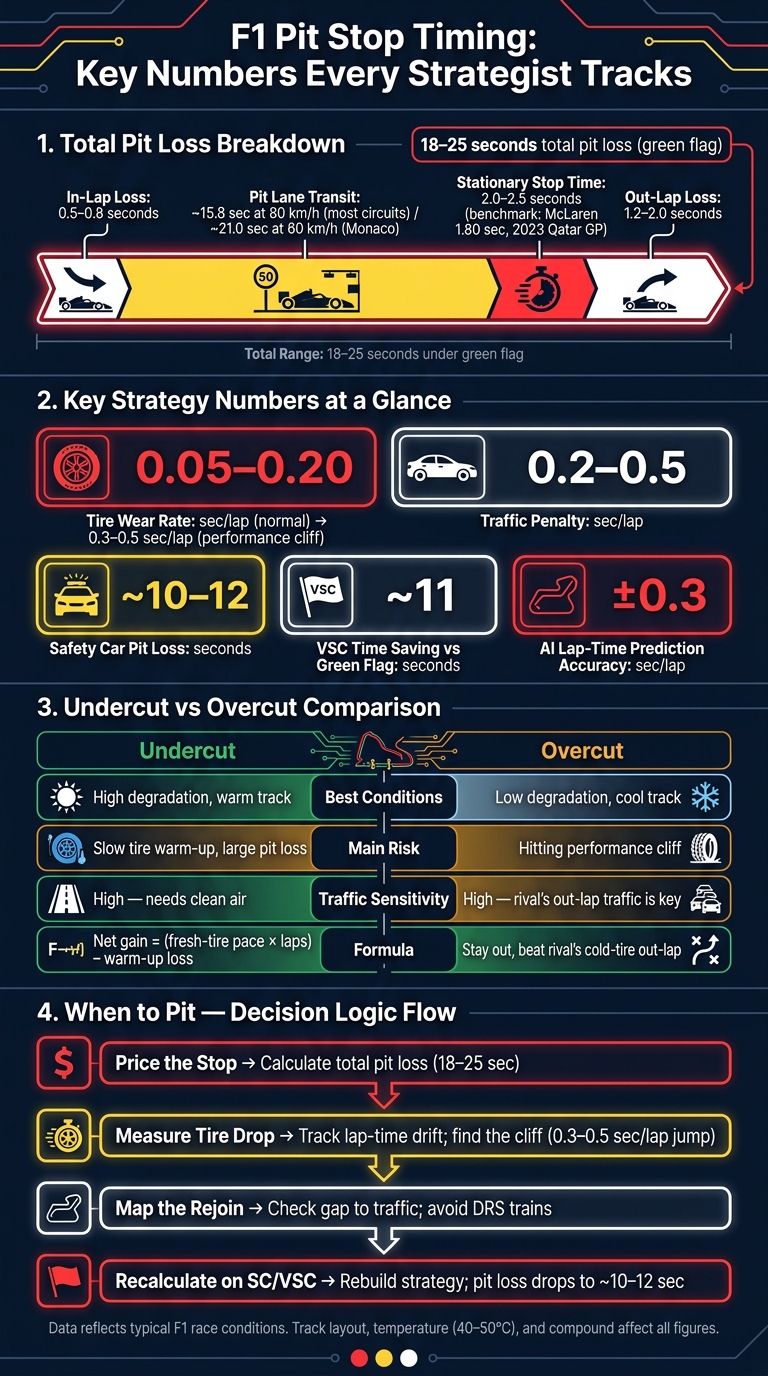
- Pit lane loss: usually 18–25 seconds
- Tire wear: often 0.05–0.20 seconds per lap before the drop gets much worse
- Traffic penalty: about 0.2–0.5 seconds per lap
- Safety Car pit loss: can fall to about 10–12 seconds
- Stationary stop time: often around 2.0–2.5 seconds
The main point: I don’t judge pit timing by instinct. I judge it by total race time. If stopping now gives a lower race-time outcome than staying out, that’s the lap to box.
| Factor | What I watch | Why it matters |
|---|---|---|
| Pit loss | Lane time, stop time, in/out-lap cost | Sets the time hurdle |
| Tire wear | Pace drop by lap and compound | Shows when staying out starts to hurt |
| Undercut/overcut | Lap-time gain over 1–3 laps | Decides if a position swap can work |
| Traffic | Rejoin spot, DRS trains, dirty air | Can kill the gain from new tires |
| SC/VSC | Reduced-speed laps and field gaps | Can turn a bad stop into a good one |
If you want to read a race the way teams do, this is the frame I’d use: price the stop, measure the tire drop, map the rejoin, then recalc everything when the race changes.
F1 Pit Stop Timing: Key Numbers Every Strategist Tracks
Every F1 Pit Strategy Explained [2026 update]
sbb-itb-7c68254
The Base Math: Pit Loss and Race Time Modeling
Once teams start thinking in total race time, the next job is to put a number on the stop itself.
The first fixed input in any pit model is pit loss. That means the full time hit from pitting, not just the moment the car stops in the box. It includes the slowdown into the lane, the drive through the pit lane at the speed limit, and the stationary stop.
The Four Parts of Total Pit Loss
Total pit loss has four parts.
In-lap loss is the time a driver gives away on the lap they pit. They lift earlier, brake before pit entry, and move off the racing line. That usually costs about 0.5–0.8 seconds compared with a clean lap on the same tire age and fuel load.
Pit lane transit is the time spent driving through the pit lane at the enforced speed limit - 80 km/h at most circuits, 60 km/h at Monaco. This is often the biggest chunk of pit loss. A 350-meter pit lane takes about 15.8 seconds at 80 km/h and 21.0 seconds at 60 km/h.
Stationary time is the time the car sits still in the box for the tire change and any extra work. Clean four-tire stops usually come in at around 2.0–2.5 seconds, with McLaren's 1.80-second stop for Lando Norris at the 2023 Qatar Grand Prix still standing out as a benchmark.
Out-lap loss covers the first lap after the stop. Cold tires, careful braking, and traffic at pit exit usually cost about 1.2–2.0 seconds compared with a fully warmed-up racing lap.
The formula is simple:
Total Pit Loss = In-Lap Loss + Pit Lane Transit + Stationary Time + Out-Lap Loss
That fixed cost is the bar every tire gain has to clear.
How Track Layout Changes the Cost of a Stop
Not every pit stop costs the same. Track layout changes the math, especially around pit entry and exit.
If the pit entry comes off a high-speed corner, the driver has to lift earlier and brake more gently. That can add 0.2–0.4 seconds to the in-lap loss. If the pit exit feeds back into a tight or blind section, the driver may need to be extra careful on the out-lap, which can add another 0.2–0.5 seconds.
It doesn't sound like much, but in race strategy, a few tenths can swing the whole picture. A cheaper stop opens the door for earlier pit calls or extra stops. A pricier one pulls teams toward longer stints and fewer trips down pit lane.
Teams refine those baseline numbers with GPS and timing-loop data from practice, qualifying, and live race laps.
Once the stop cost is set, they weigh it against tire loss, traffic, and the upside of clean air to work out the best lap to pit.
Finding the Pit Window: Degradation, Traffic, and Undercut Math
Once pit loss is set, teams get down to the main question: which lap gives the best net race time? The pit window opens when the time gained from fresher tires first becomes bigger than the time lost in the stop. That window can shrink or stretch depending on how tire pace falls away lap by lap. To judge it, teams stack three things side by side: degradation, undercut pace, and traffic.
Reading Degradation Curves and the Performance Cliff
A degradation curve shows lap time against lap number for a given compound and fuel load. Early in a stint, lap times can level off a bit. After that, they often start climbing by around 0.05–0.10 seconds per lap until the tire hits the performance cliff. That’s the point where lap-time loss can jump to 0.3–0.5 seconds per lap or more because the tire overheats or starts graining badly.
Track conditions can move that cliff around. At track temperatures of 104–122°F (40–50°C), which are common at Bahrain or Barcelona, thermal degradation gets worse and the cliff tends to arrive earlier. That can push base degradation closer to +0.10–0.20 seconds per lap and cut down the usable life of softer compounds. Teams build these estimates from practice long runs and live track-temperature data, then adjust the model lap by lap during the race.
The sweet spot for the stop is usually just before the cliff. Pit too soon, and the team leaves usable tire life on the table. Pit too late, and the car starts leaking time on cliff laps that are hard to get back.
Undercut and Overcut: The Lap-by-Lap Gain Calculation
Once the degradation curve sets the outer edge of the pit window, teams decide how to play it against the cars around them.
An undercut means pitting before the car ahead. The idea is simple: use fresh tires to put in a strong out-lap while the other car is still circulating on worn rubber, then jump ahead when that rival makes its stop. The basic math looks like this:
Net undercut gain = fresh-tire pace gain × laps gained − warm-up loss
Say the fresh-tire edge is 0.8 seconds per lap, the undercut car gets two laps before the rival pits, and the warm-up penalty is 0.4 seconds. The net gain comes out to 1.2 seconds. If the gap on track is bigger than that, the undercut doesn’t work unless the other car loses time on pit entry or during the stop itself. In most cases, teams study undercuts 1 to 3 laps before the direct rival.
An overcut works the other way. The trailing car stays out longer and bets on the rival having a weak out-lap on cold tires. It usually works best when degradation is low, the track is cool, or the rival is likely to rejoin into traffic. In those cases, fresh tires may take longer to switch on, and the edge from new rubber is smaller.
Here’s the quick read on where each play tends to land:
| Undercut | Overcut | |
|---|---|---|
| Best conditions | High degradation, warm track, abrasive surface | Low degradation, cool track, slow tire warm-up |
| Main risk | Tire warm-up too slow, pit loss too large | Hitting the performance cliff, rival undercuts cleanly |
| Traffic sensitivity | High - needs clean air after the stop | High - the rival's traffic on the out-lap is the key lever |
| Likely payoff | Position gain if out-lap pace beats the rival's worn-tire laps | Gains position if old tires stay competitive longer |
Of course, even perfect timing can fall apart if the car drops back into the wrong traffic pocket.
Traffic Mapping and Rejoin Position
A stop can look great on paper and still fail on track. The usual reason? The car rejoins behind traffic it can’t get past.
To check that risk, strategists run a virtual pit stop in their software. They subtract pit loss from the target car’s timeline and project where it will slot in compared with every other car on track. That projection shows whether the car comes back into clean air, a DRS train, or behind a slower car on a different plan. And that matters a lot. A DRS train can wipe out the edge of fresh tires by pinning the car in traffic and shutting down overtaking chances.
The rejoin model also uses time gaps. For example, a 20-second gap to the car behind often means the stop will drop the target car back into that fight. Teams refresh these projections every lap as gaps move and pace models change, which is why a call to pit can flip within a single lap.
That whole picture changes at once when a Safety Car or VSC bunches the field.
Race Interruptions and Live Decisions on the Pit Wall
Pre-race models usually assume green-flag running. The moment a Safety Car (SC) or Virtual Safety Car (VSC) appears, that math changes fast. It’s still the same pit-window model, but now it has to work under neutralization.
Safety Car and VSC: When the Pit Window Shifts
A full Safety Car can cut the effective pit-loss time to about 10–12 seconds. A VSC can save roughly 11 seconds compared with a green-flag stop, which is enough for rivals to jump a race leader and swing the result.
The two neutralizations don’t work the same way. A full SC bunches the field behind the safety car, wipes out gaps, and turns the restart into a race inside the race. A VSC keeps the field spread out, but drivers must follow a time delta running at roughly 30–40% below normal race pace, checked in each mini-sector by the FIA system. So a VSC opening is often more of a straight time calculation: how much can you save versus the cars around you? A full SC adds another layer because restart track position matters so much.
When either one happens, teams usually weigh three paths:
| Option | Main advantage | Main risk |
|---|---|---|
| Pit under caution | Uses the lower pit-loss time; can switch to a better compound | May rejoin in heavy traffic; gives up immediate track position |
| Stay out | Keeps track position for the restart | Stays on older tires; open to attack from cars on new rubber |
They then score those calls against expected final race time, restart position, and second-SC/VSC risk. That turns what looks like a snap call into a structured decision.
The Live Decision Stack: Gaps, Degradation, Risk, and Rules
Before making the call, strategists check tire drop-off, the gap needed for a clean rejoin, the chance of a second SC or VSC, and any rule limits that shape the move.
At its core, the process follows a plain logic chain: Is tire drop-off worse than the model expected? → Does the cheaper stop create a clean rejoin gap? → Do the rules and likely race path still support the stop? → If yes, pit. If no, stay out and check again next lap.
Where AI-Assisted Strategy Fits and Where Humans Still Decide
Software cuts down the option set. The pit wall still makes the last call on risk.
Current strategy systems take in live timing, GPS position, and telemetry all the time, then run Monte Carlo simulations - sometimes tens of thousands of race scenarios - to score pit options as soon as a neutralization starts. Lap-time prediction models usually land within about ±0.3 seconds per lap, using fuel load, tire age, compound, and track temperature. When an SC or VSC appears, the system re-runs the race tree at once: pit now, pit next lap, stay out, or shorten the next stint. It then returns ranked options.
That said, model output is just the first draft of the decision. Overtaking difficulty is still hard to put into numbers. A strategy that looks fast on paper can fall apart if it depends on passing several cars at a track where passing is tough. Driver-specific tire behavior matters too. Some drivers can stretch a worn set much longer than a general wear model suggests, while others trigger graining on a compound much sooner in certain conditions. Then there’s incident reading: deciding whether a damaged car is likely to bring out a second SC, or whether a weather shift changes the risk profile, still leans on context and judgment that raw data can’t fully cover. In the end, human strategists decide how much risk they want to take.
Conclusion: How Data Connects Pit Timing to Race Strategy
Pit timing in F1 is never a standalone call. Teams weigh pit loss, tire drop-off, traffic, undercut odds, and caution timing at the same time to find the lowest total race time. They’re not working through a simple checklist. They’re updating the model lap by lap.
Key Points to Use in Any Race Analysis
Use this sequence in any race analysis:
- Anchor on pit loss. It’s the fixed cost of any strategy move.
- Track lap-time drift through each stint and spot where tire wear starts to speed up beyond the normal trend. That’s the cliff. The stop should come just before it.
- Test the undercut by comparing fresh-tire pace with the rival’s worn-tire laps. If the fresh compound is worth about 1.0–1.5 seconds per lap for at least one lap, and the gap before the stop is smaller than that projected gain, the undercut is a strong move.
- Map the rejoin by subtracting pit loss from the driver’s current gap to the leader, then check if that spot means clean air or slower traffic.
- If a Safety Car or VSC appears, rebuild the strategy call from scratch. Recalculate pit loss for that lap using the slower field pace, then review every option again.
That’s the core of data-led pit timing: model the stop, price the trade, and make the call before the window shuts.
FAQs
How do teams calculate the ideal pit window?
Teams work out the ideal pit window with race simulations that blend past race data with live telemetry. Engineers look at tire wear, fuel load, track grip, pit lane time loss, and gaps in traffic to figure out when a driver can come back out in clean air.
They also compare lap times on worn tires against lap times on fresh ones. The plan is usually set on race morning, then tweaked during the race as live data shifts the strategy.
When does an undercut work better than an overcut?
An undercut tends to work best on high-degradation circuits. On those tracks, fresh tires usually bring a clear pace edge over cars still running on older rubber. Pit earlier, and that extra speed can add up fast enough to win track position.
An overcut is often stronger on low-degradation tracks, especially in cooler conditions. In those cases, staying out longer doesn't cost as much time. It can work even better when the driver gets clear air after a rival pits.
Why can traffic ruin a good pit strategy?
Traffic can wreck an otherwise smart pit call. Fresh tires only help if the driver can use them. If they come back out behind slower cars, that extra pace gets boxed in, and the time won in the stop can vanish. That’s how an undercut goes from clever to pointless.
Teams watch traffic gaps in real time for exactly this reason. On tracks where passing is hard, getting trapped in traffic doesn’t just cost a corner or two. It can turn into a steady lap-time loss and, with it, lost track position.