6 Sponsor Metrics Tied To Constructors' Finish
Compare six sponsor metrics with 2025 Constructors' results (vs 2024) to separate visibility from actual sponsor value.
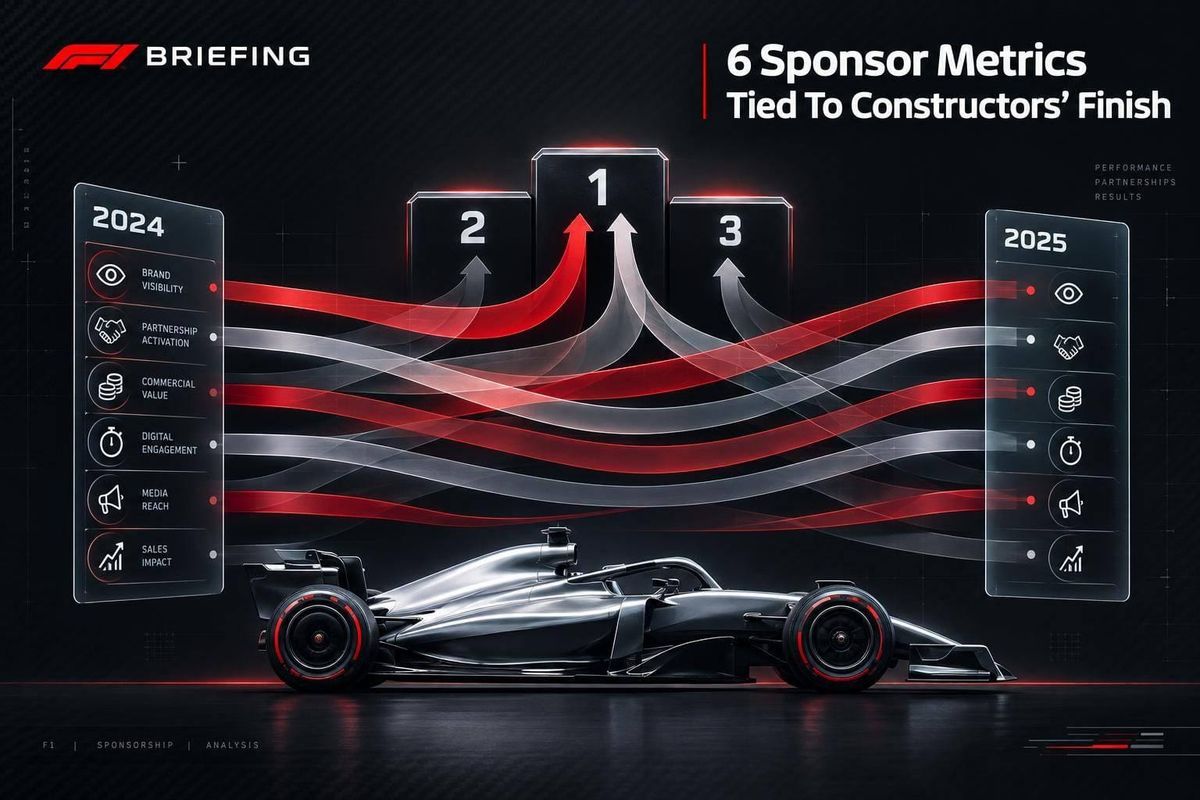
A better Constructors’ finish does not prove better sponsor returns. I compare 6 metrics against final rank using 2025 results and a 2024 baseline:
- Screen time: How long sponsor logos appear on broadcasts.
- Podium rate: How often the team earns podium finishes.
- Social growth: Changes in followers and engagement.
- Hospitality use: Guest attendance and client conversions.
- Press mentions: Sponsor-and-team coverage and its sentiment.
- Partner renewal rate: The share of eligible partners that renew.
I use the same measurement rules for both seasons, keep missing data separate from zero, and check driver popularity, campaigns, and contract timing before drawing conclusions. For example, a renewal rate moving from 60% to 75% is a 15-percentage-point increase - not proof that race results caused it.
My rule: <u>compare results, exposure, and customer outcomes together</u>. More visibility alone is not ROI; I also need fees, activation costs, and attributable customer results.
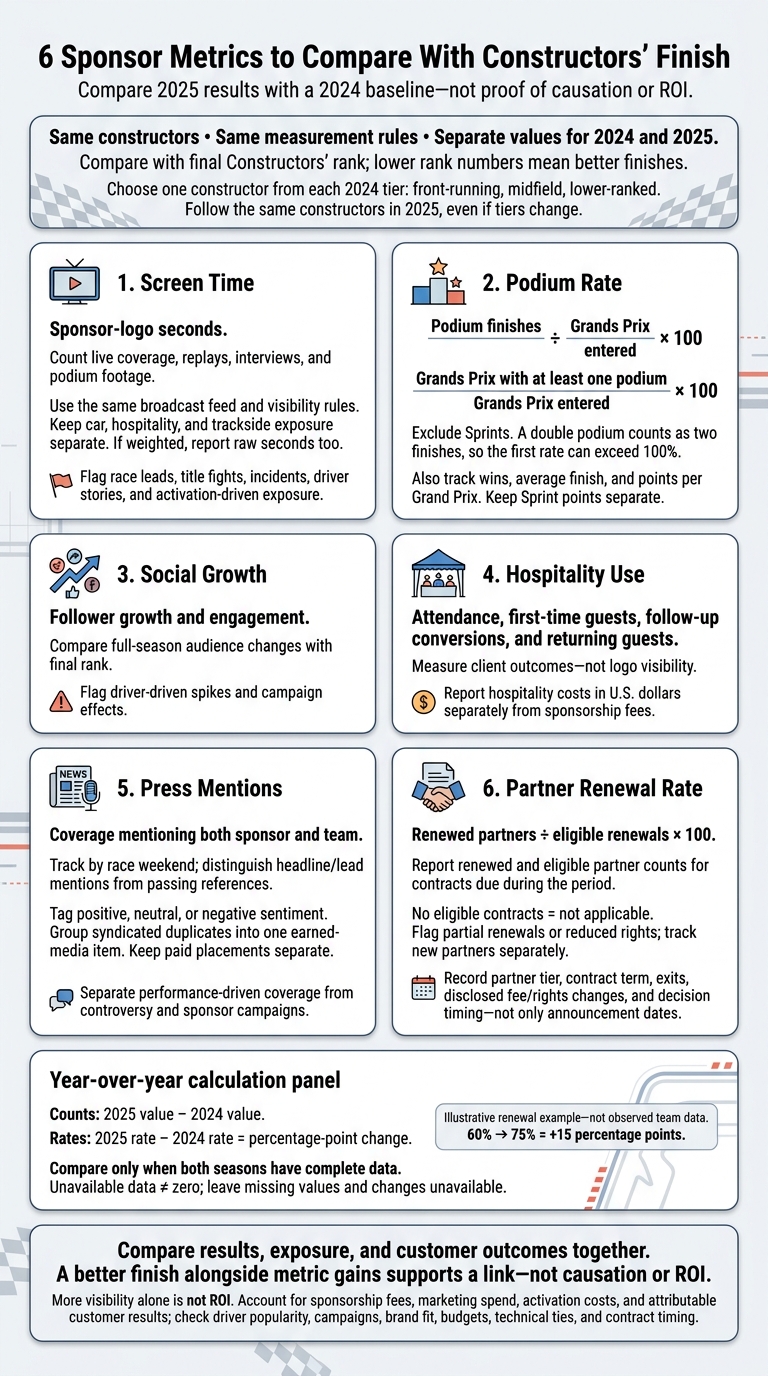
6 Sponsor Metrics to Compare With Constructors’ Finish
Metrics 1–2: Screen Time and Podium Rate
1. Screen Time: Track Visible Sponsor Logos
Front-running teams usually get more broadcast visibility. To measure it, compare sponsor-logo seconds with final Constructors’ rank. Count visibility across live coverage, replays, interviews, and podium footage.
Keep car, hospitality, and trackside exposure separate so circuit branding doesn’t inflate sponsor results. Use the same broadcast feed and visibility rules across both seasons. If you use a weighted score, document it alongside the raw seconds.
Label what drove the coverage: race leads, title fights, incidents, or driver stories. Separate passive exposure from activation-driven exposure. Podium rate helps show whether visibility came from repeated front-running performances or isolated spikes.
2. Podium Rate: Track Finishes and Race Presence
Next, measure results. Calculate podiums per Grand Prix entered × 100, excluding Sprints. A double podium counts as two finishes, so this rate can exceed 100%.
Also report Grands Prix with at least one podium ÷ Grands Prix entered × 100. Together, these rates help separate repeat podium finishes from double-podium weekends.
Track wins, average finish, and points per Grand Prix, too. Keep Sprint points separate. Read these measures alongside final rank, but don’t treat podium frequency as ROI.
sbb-itb-7c68254
Metrics 3–4: Social Growth and Hospitality Use
3. Social Growth: Track Followers and Engagement
Check whether broadcast exposure led to audience growth across the full season. Compare follower growth and engagement with the final Constructors’ rank. Flag driver-driven spikes so they don’t skew team-level results.
Then, check whether hospitality turned audience interest into client contact.
4. Hospitality Use: Track Attendance and Client Results
Judge hospitality by who attended, who converted, and who returned - not logo visibility. Track attendance, first-time guests, and follow-up conversions. Report hospitality costs in U.S. dollars separately from sponsorship fees.
Metrics 5–6: Press Mentions and Partner Renewals
5. Press Mentions: Track Coverage and Sentiment
After hospitality, check whether on-track success translated into earned media. Press mentions help show whether a stronger finish earned more coverage.
Count articles and broadcasts that mention both the sponsor and team, then track those mentions by race weekend. Separate headline or lead mentions from passing references. Compare coverage with wins, podiums, title battles, and final rank.
Keep performance-driven stories separate from coverage driven by controversy or sponsor campaigns. More coverage doesn’t always mean more value. Tag sentiment as positive, neutral, or negative, group syndicated duplicates into one earned-media item, and keep paid placements separate.
6. Partner Renewal Rate: Track Eligible Contracts
Next, check whether that visibility helped retain partners at renewal time - and whether final rank gave the team more leverage.
Calculate partner renewal rate = renewed partners ÷ eligible renewals × 100. Report both the number of renewed partners and eligible renewals for contracts due during the period. Mark the rate as not applicable when no contracts qualify.
Record exits, partner tier, contract term, and disclosed changes to fees or rights separately. Flag partial renewals or reduced rights so a smaller deal doesn’t look the same as an unchanged agreement. Track new partners separately, too.
Renewal is only part of the picture: brand fit, budget, and technical ties also affect retention. Compare renewals with final rank, recent points, and championship history using verified records. Note whether decisions happened before or after the finale, since announcement dates may not show when negotiations ended.
F1 Sponsorship Explained: Driver Sponsors vs Team Sponsors - Who Makes More Money?
Conclusion: Compare All 6 Metrics
Compare all six metrics together. A better finish alongside gains across the metrics supports a link - not causation or ROI. If visibility grows but engagement doesn’t, investigate further.
Build a 2024–2025 Comparison Scorecard
Use the scorecard to compare each metric with final Constructors’ rank. Choose one constructor from each 2024 tier, then track those same constructors in 2025, even if they change tiers. Leave unavailable fields blank.
| Selected constructor group | Seasons | Final rank / points / podiums | Screen time | Podium rate | Social growth | Hospitality use | Press mentions | Partner renewal rate | 2025 vs. 2024 change |
|---|---|---|---|---|---|---|---|---|---|
| Front-running | 2024; 2025 | - | - | - | - | - | - | - | N/A |
| Midfield | 2024; 2025 | - | - | - | - | - | - | - | N/A |
| Lower-ranked | 2024; 2025 | - | - | - | - | - | - | - | N/A |
Enter separate values for each season and use the same definitions for both. Em dashes mean unavailable data, not zero. Lower rank numbers mean better finishes.
Compare 2025 with 2024 only when both seasons have complete data. For counts, subtract 2024 values from 2025 values. For rates, calculate the percentage-point change. Leave the change unavailable if either value is missing. Add a screen-time-versus-rank scatterplot only if coverage is comparable.
When assessing sponsor value linked to final Constructors’ rank, don’t call it profit until you account for sponsorship fees, marketing spend, activation costs, driver popularity, contract timing, and attributable customer results.
FAQs
How can I isolate race results’ impact on sponsor value?
Track podium rate, screen time, and audience attention together. Compare social growth and press mentions across races when constructors’ standings are better or worse. Check whether engagement spikes line up with hospitality use on stronger race weekends, and monitor partner renewal rate as a lagging indicator.
Use real-time engagement data and dynamic, data-driven sponsor placements to help separate value changes tied to on-track performance from those driven by general brand exposure [3].
How should I weigh the six sponsor metrics?
Balance results with the partner experience, using final standings to link performance to commercial value. Give podium rate and press mentions the greatest weight when measuring sporting impact. Then use screen time and social growth to assess reach and audience response.
Treat hospitality use as a secondary measure of activation quality. Use partner renewal rate to validate the overall package later, adjusting for final standings. Review the weights midseason as each measure’s relevance changes.
Can lower-ranked teams deliver better sponsor ROI?
Yes. Lower-ranked teams can deliver better sponsor ROI by focusing on performance per dollar - not just podium finishes. Track screen time, social growth, hospitality engagement, and press mentions. Tie partner renewals to improvements after each event and how those results align with final standings.
Use that data to move resources from low-return performance efforts to higher-return operational or fan-engagement improvements. [3]