Track Data Models for F1 Pit Calls
Track data and simulations convert pit loss, tire warm-up, and traffic into ranked F1 pit-call decisions for tracks like Monaco and Monza.
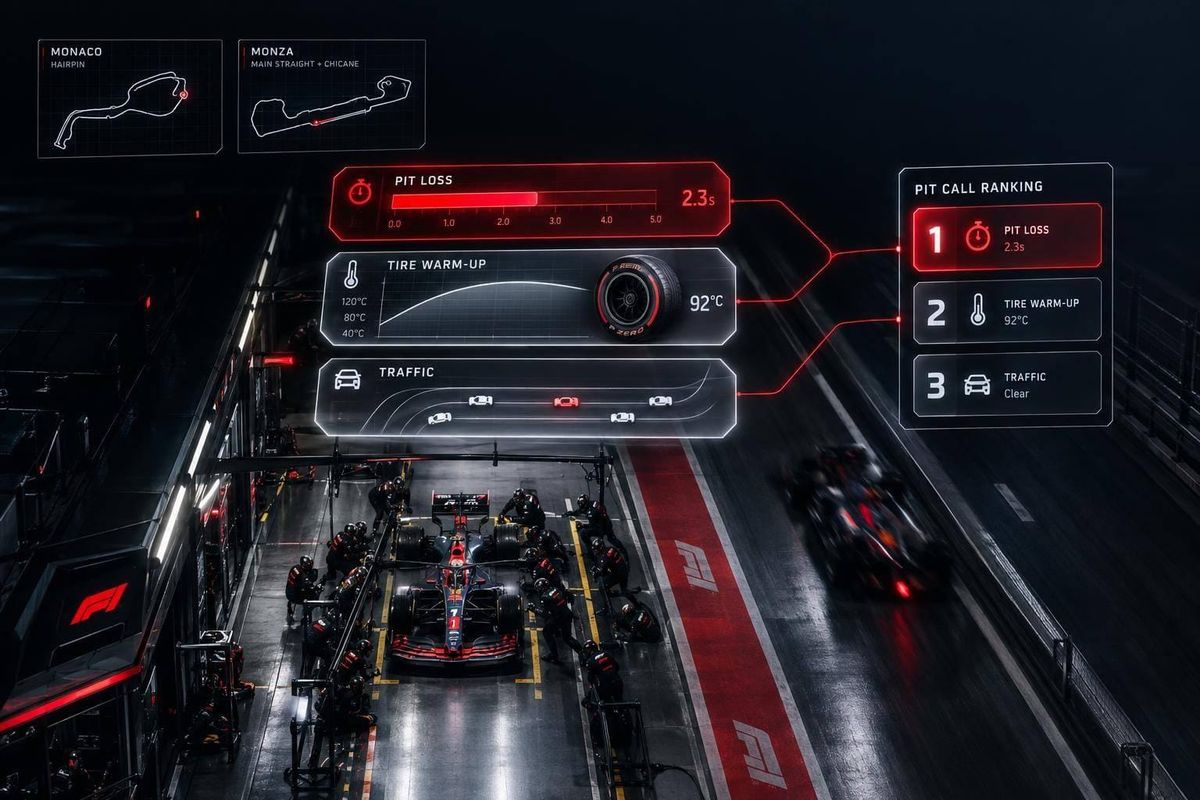
I judge an F1 pit call by one question: Will new tires repay the time lost stopping - and getting back through traffic? A 21-second pit loss needs more than 21 seconds of tire gains if warm-up and traffic add further delays. That figure is a Monaco reference, not a rule for every track.
Here’s how I break down the decision:
- Measure pace: Use lap and sector data to separate tire wear from fuel effects, traffic, and track changes.
- Count the cost: Add pit-lane time, tire warm-up, and rejoin delays without counting any loss twice.
- Match the circuit: At Monaco, protect track position. At Monza, weigh tire life against the chance of catching and passing rivals.
- Test each option: Compare stopping now with waiting, including rival stops, weather, Safety Cars, and current event rules.
My final check is <u>whether the call still works when the estimates are wrong</u>. I compare likely results and downside risk, update the forecast with live timing, and check it against race data afterward.
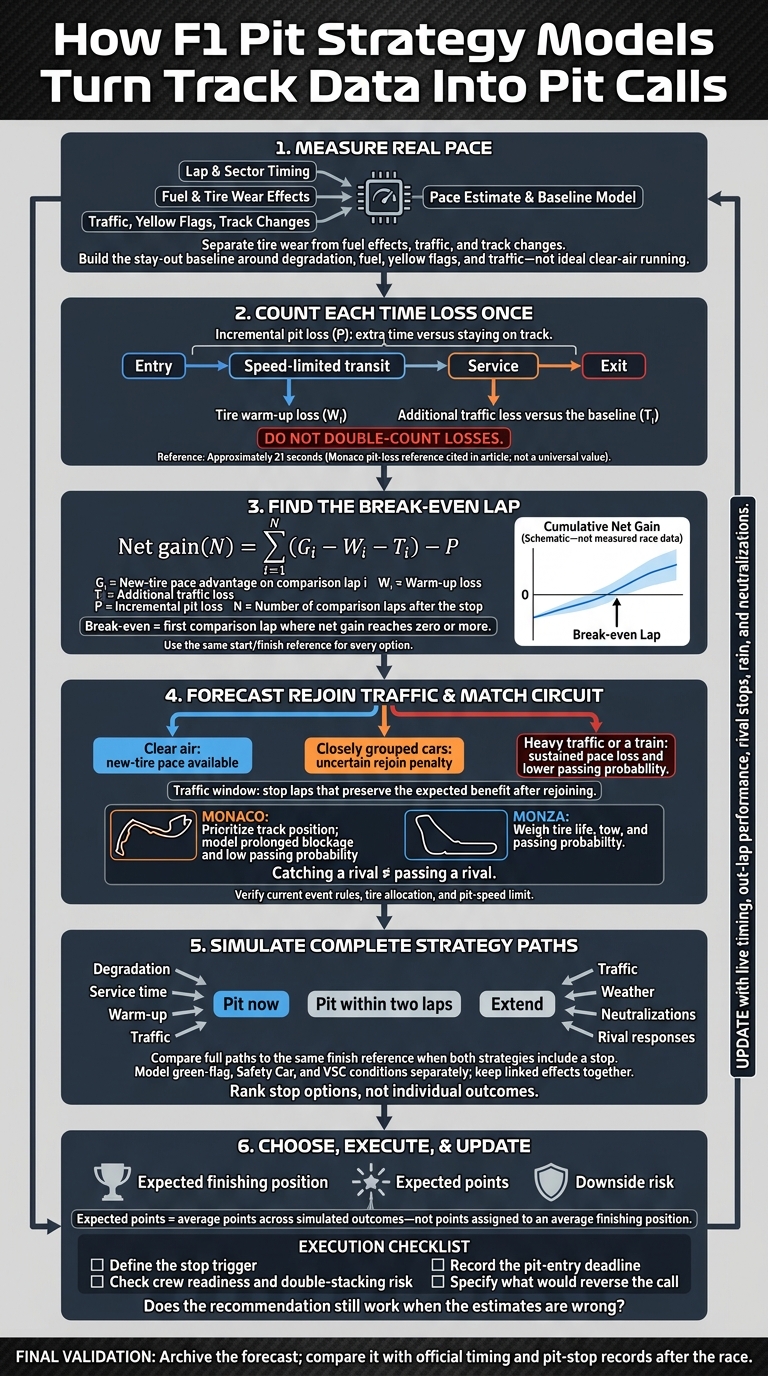
How F1 Pit Strategy Models Turn Track Data Into Pit Calls
F1 Race Strategy Simulator & Predictor using Python
sbb-itb-7c68254
Calculating the Time Cost of a Pit Stop
Use the same start/finish reference for every option, measuring elapsed time to that point on the stop lap and each comparison lap. This turns sector loss into a stop-versus-stay-out decision. Build the stay-out baseline around degradation, fuel, yellow flags, and traffic - not ideal clear-air running. Track entry, transit, service, exit, warm-up, and traffic costs separately. Count each second only once.
Pit Loss and the Break-Even Lap
Incremental pit loss is the extra time spent taking the pit-lane route rather than staying on track. It includes entry, speed-limited transit, service, and exit. Calculate it from those inputs, and calibrate green-flag pit loss for each circuit.
Formula 1’s Monaco analysis used approximately 21 seconds as a pit-stop time-loss reference point; that should not be generalized to every circuit.
Do not count any component twice if it is already part of total pit loss. Keep post-exit tire warm-up and traffic penalties separate.
Net gain after a stop is:
[ \text{Net gain}(N)=\sum_{i=1}^{N}(G_i-W_i-T_i)-P ]
Here, (G_i) is the new-tire pace advantage, (W_i) is warm-up loss, (T_i) is additional traffic loss relative to the baseline, and (P) is incremental pit loss. The break-even lap is the first comparison lap where net gain reaches zero or more.
If both strategies include a stop, compare their full paths to the same finish reference. Model Safety Car and Virtual Safety Car stops separately: controlled speeds and changing gaps affect both pit loss and rejoin position.
Tire Warm-Up, Degradation, and the Undercut
Treat warm-up as an early-lap penalty and degradation as the pace decline that follows. Compound, tire condition, track temperature, driver preparation, and available energy deployment all shape that curve.
An undercut works when immediate new-tire gains outweigh warm-up and traffic losses. An overcut benefits from competitive old tires or a rival’s slow warm-up.
Plot cumulative net gain by lap after the stop, mark the zero line, and shade the range from best-case to worst-case outcomes. This shows whether break-even is still within reach when warm-up takes longer than expected.
Predicting Rejoin Gaps and Traffic Windows
A traffic window is the range of stop laps that preserves the expected benefit after rejoining. For each candidate lap, simulate the rejoin gap, nearby cars’ pace, their probability of pitting, lapped traffic, and the probability of passing. Update passing assumptions for the current rules package, including Overtake Mode and active aero, using the applicable FIA rules and event documents.
Where the car rejoins determines whether the stop still pays off.
| Rejoin condition | Typical model treatment | Passing difficulty | Model response |
|---|---|---|---|
| Clear air | Low traffic penalty; new-tire pace is fully available | Low | Favor the stop if cumulative tire gain repays pit loss |
| Closely grouped cars | Apply a stochastic rejoin penalty based on gaps and relative pace | Medium to high | Shift the stop to find clear air |
| Heavy traffic or a train | Add sustained pace loss and a lower probability of passing | High, especially at Monaco | Reject marginal stops unless tire gain or a neutralization creates a strong advantage |
How Pit Models Differ at Monaco and Monza
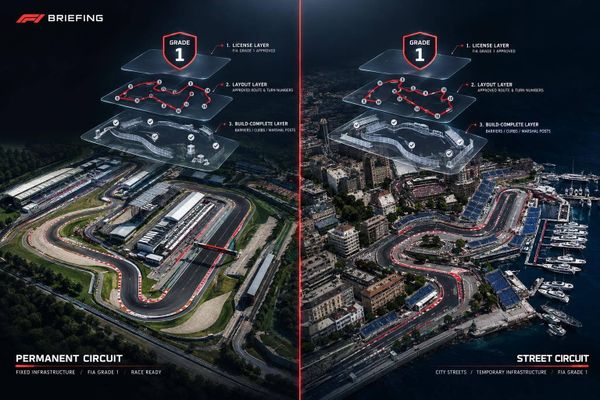
Keep the model structure, but adjust the weighting and error tolerance for each circuit.
| Model input | Monaco | Monza | Input source |
|---|---|---|---|
| Pit-lane cost | 60 km/h limit in 2026 | Event-specific measured lane loss | Event rules and measured timing |
| Track position | Lost positions are usually unrecoverable | Positions can be recovered with pace and a tow advantage | Race simulations |
| Tire performance | Give more weight to low-speed warm-up and traction; degradation is generally low | Give more weight to braking stability, acceleration, tire life, and graining risk | Long-run data, tire-age and sector timing |
| Passing probability | Low; model prolonged blockage | Account for tow, speed difference, corner exits, and defensive positioning | Traffic simulations |
| Sector weighting | Prioritize traction, consistency, and exposure to slower cars | Prioritize braking zones and exits onto long straights | Clean-air and traffic-adjusted sectors |
| Rejoin risk | The usable window collapses around queues | The window depends on tow and pass rate | Gap forecasts and rival-stop simulations |
| Tire-use and stop rules | Use current tire-allocation rules, not last season’s two-stop format | Use current tire-use rules and allocation, not a previous race’s strategy baseline | Sporting regulations and event documents |
At Monaco, the model centers on track position, not how much life remains in the tires.
Monaco: Track Position and Rejoin Risk
Monaco’s 2026 pit-lane limit was 60 km/h, below the 80 km/h default. With otherwise equal lane geometry, the slower limit adds pit loss, pushes the break-even threshold higher, and makes a stop on the wrong lap more costly. Alpine notes that the event also moved from the previous season’s special two-stop requirement back to the standard tire-use framework. Track tire-allocation rules separately from stop count, including wet-race exceptions.
Low-speed traction and consistent sectors matter because even a small mistake can erase the gap needed for a clean rejoin. Compare traffic-adjusted sectors with clean-air sectors at similar tire ages. A tire advantage offers little help if the driver cannot pass. Pay close attention to the forecast’s prolonged-blockage outcome: an average rejoin estimate can hide the risk of getting stuck.
Monza shifts the balance toward tire life and passing probability, with less weight on protecting track position.
Monza: Tire Life and Passing Chances
At Monza, link tire condition to specific chances to pass. Better braking and acceleration can help, but straight-line efficiency and a tow determine whether the car reaches the braking zone close enough to attack. Catching a car and passing it are separate gains. A traffic window only helps if the model leaves enough time to complete those passes.
2024 Italian Grand Prix: Leclerc’s one-stop victory illustrates Pirelli’s finding that the predicted fastest one-stop strategy depended on tire condition and driver management.
Use this case to test whether observed stint pace supports extending the stint - not as a prescription for 2026. Tire allocation, weather, car characteristics, and applicable rules must come from the race being modeled.
Turning Race Simulations Into Pit Calls
Simulating Stop Laps and Rival Responses
Feed the break-even lap, pit-loss estimate, and traffic window into a scenario tree or Monte Carlo model. Rank stop options, not outcomes. Test each stop lap against different degradation rates, service times, tire warm-up, traffic, weather, neutralizations, and rival reactions. Keep linked effects together: a Safety Car changes both pit loss and field order. Give rivals plausible responses - cover immediately, extend, or switch compounds - instead of assuming they'll stick to a fixed plan.
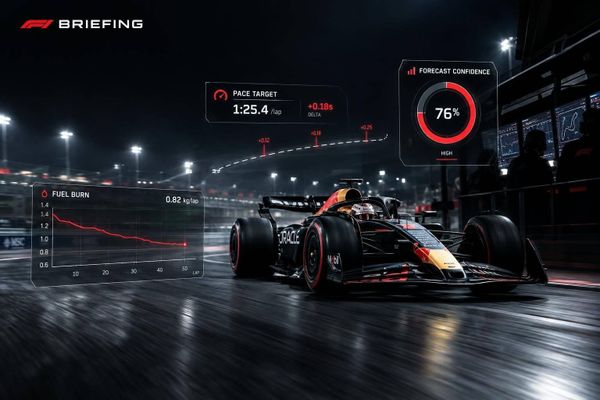
Set the objective before comparing results. Expected points means averaging the points scored across simulated outcomes, not converting an average finishing position into points. Update forecasts every lap when data allows, and immediately after rival stops, rain, or neutralizations. Replace assumptions with measured sector times and out-lap performance, and timestamp the latest forecast update.
| Decision objective | What it ranks | Main caution |
|---|---|---|
| Expected finishing position | Average finishing position across simulations | Can hide a small chance of a major loss |
| Expected points | Average championship points across outcomes | Does not necessarily favor the lowest-risk option |
| Downside risk | Probability of missing the points or losing to a key rival | May sacrifice the upside needed to win |
Deciding Whether to Pit or Extend
Simulation turns sector-loss and traffic estimates into a ranked pit call after the model weights expected finish, points, and downside risk.
Illustrative only: the same gap can lead to different calls under the same track conditions.
| Rank | Action | Expected finish | Probability of finishing outside the points | Illustrative outcome range |
|---|---|---|---|---|
| 1 | Pit now | 5th | 8% | 3rd–9th |
| 2 | Pit within two laps | 5th–6th | 11% | 3rd–10th |
| 3 | Extend | 6th | 22% | 4th–13th |
Strong out-lap performance may favor stopping. Slow warm-up or difficulty passing may favor extending. Use driver-specific evidence where available, not reputation. A team chasing victory may accept a broader range of outcomes, while one protecting points may focus on limiting losses. For “pit within two laps,” define what triggers the stop. Waiting alone isn't a complete strategy.
The crew and driver must also be able to carry out the call. Driver feedback on graining, crew readiness, and teammate double-stacking can change both pace and service-time risk. Record the pit-entry decision deadline and what would reverse the recommendation. Flag blind spots, including unknown rival tire condition, sparse wet-weather data, or damage the model can't represent.
Conclusion: Pit-Call Model Checklist
A pit call depends on linked variables - not one fixed pit-loss figure. Track data informs sector-loss, pit-loss, and traffic-window estimates, which help determine whether new tires offer a net gain. The same model works for both circuits, but the weights change: Monaco puts track position first, while Monza allows more room to weigh tire life and passing chances. Check those tendencies against the weekend’s timing data.
Base the call on official FIA timing, event notes, Pirelli data, and attributable team explanations - not unsupported assumptions. Before the call goes live, check for these common model errors:
- Pit loss: Calibrate pit-lane loss using official timing and comparable green-flag laps. Account for traffic separately.
- Tire behavior: Separate warm-up from steady degradation, and check both sector by sector.
- Rejoin forecast: Assign probabilities to clean air, traffic, lost positions, and rivals’ responses with their own stops.
- Neutralizations: Model green-flag, Safety Car, and VSC conditions separately. A Safety Car compresses the field; a VSC does not create the same queue.
- Applicable rules: Verify the season, layout, tire rules, pit-speed limit, and event notes.
- Uncertainty: Show input ranges and test whether the call holds up under best-case and worst-case assumptions.
- Post-race validation: Archive the forecast, then compare it with official timing and pit-stop records.
FAQs
How do teams separate tire wear from fuel effects?
F1 teams use race strategy simulators and telemetry to distinguish lap-time gains from burning fuel from time lost to thermal degradation and tire wear.
Engineers track tire degradation lap by lap, checking it against known fuel-load curves and sector times. The simulations also account for engine modes and fuel consumption. This helps strategists isolate tire-related performance losses and predict pit windows.
How accurate are pit-stop traffic forecasts?
Advanced models trained on Formula 1 telemetry data forecast optimal pit-stop timing with 0.77 precision and 0.86 recall.
Teams pair real-time GPS-based timing data with past performance to find gaps in traffic, helping drivers rejoin in clean air. But these forecasts reflect probabilities, not guarantees. Driver performance, unpredictable safety car deployments, and sudden weather changes can all affect accuracy.
When should driver feedback override a pit model?
Driver feedback can override a pit model when grip, balance, tire feel, or aquaplaning conditions tell a story the sensors may miss. It gives the team one last check before committing to a pit stop.
Strategists weigh that feedback against simulations, telemetry, radar, sector times, and lap deltas. They look for agreement across those signals before backing the model’s recommendation - or overriding it.